
|
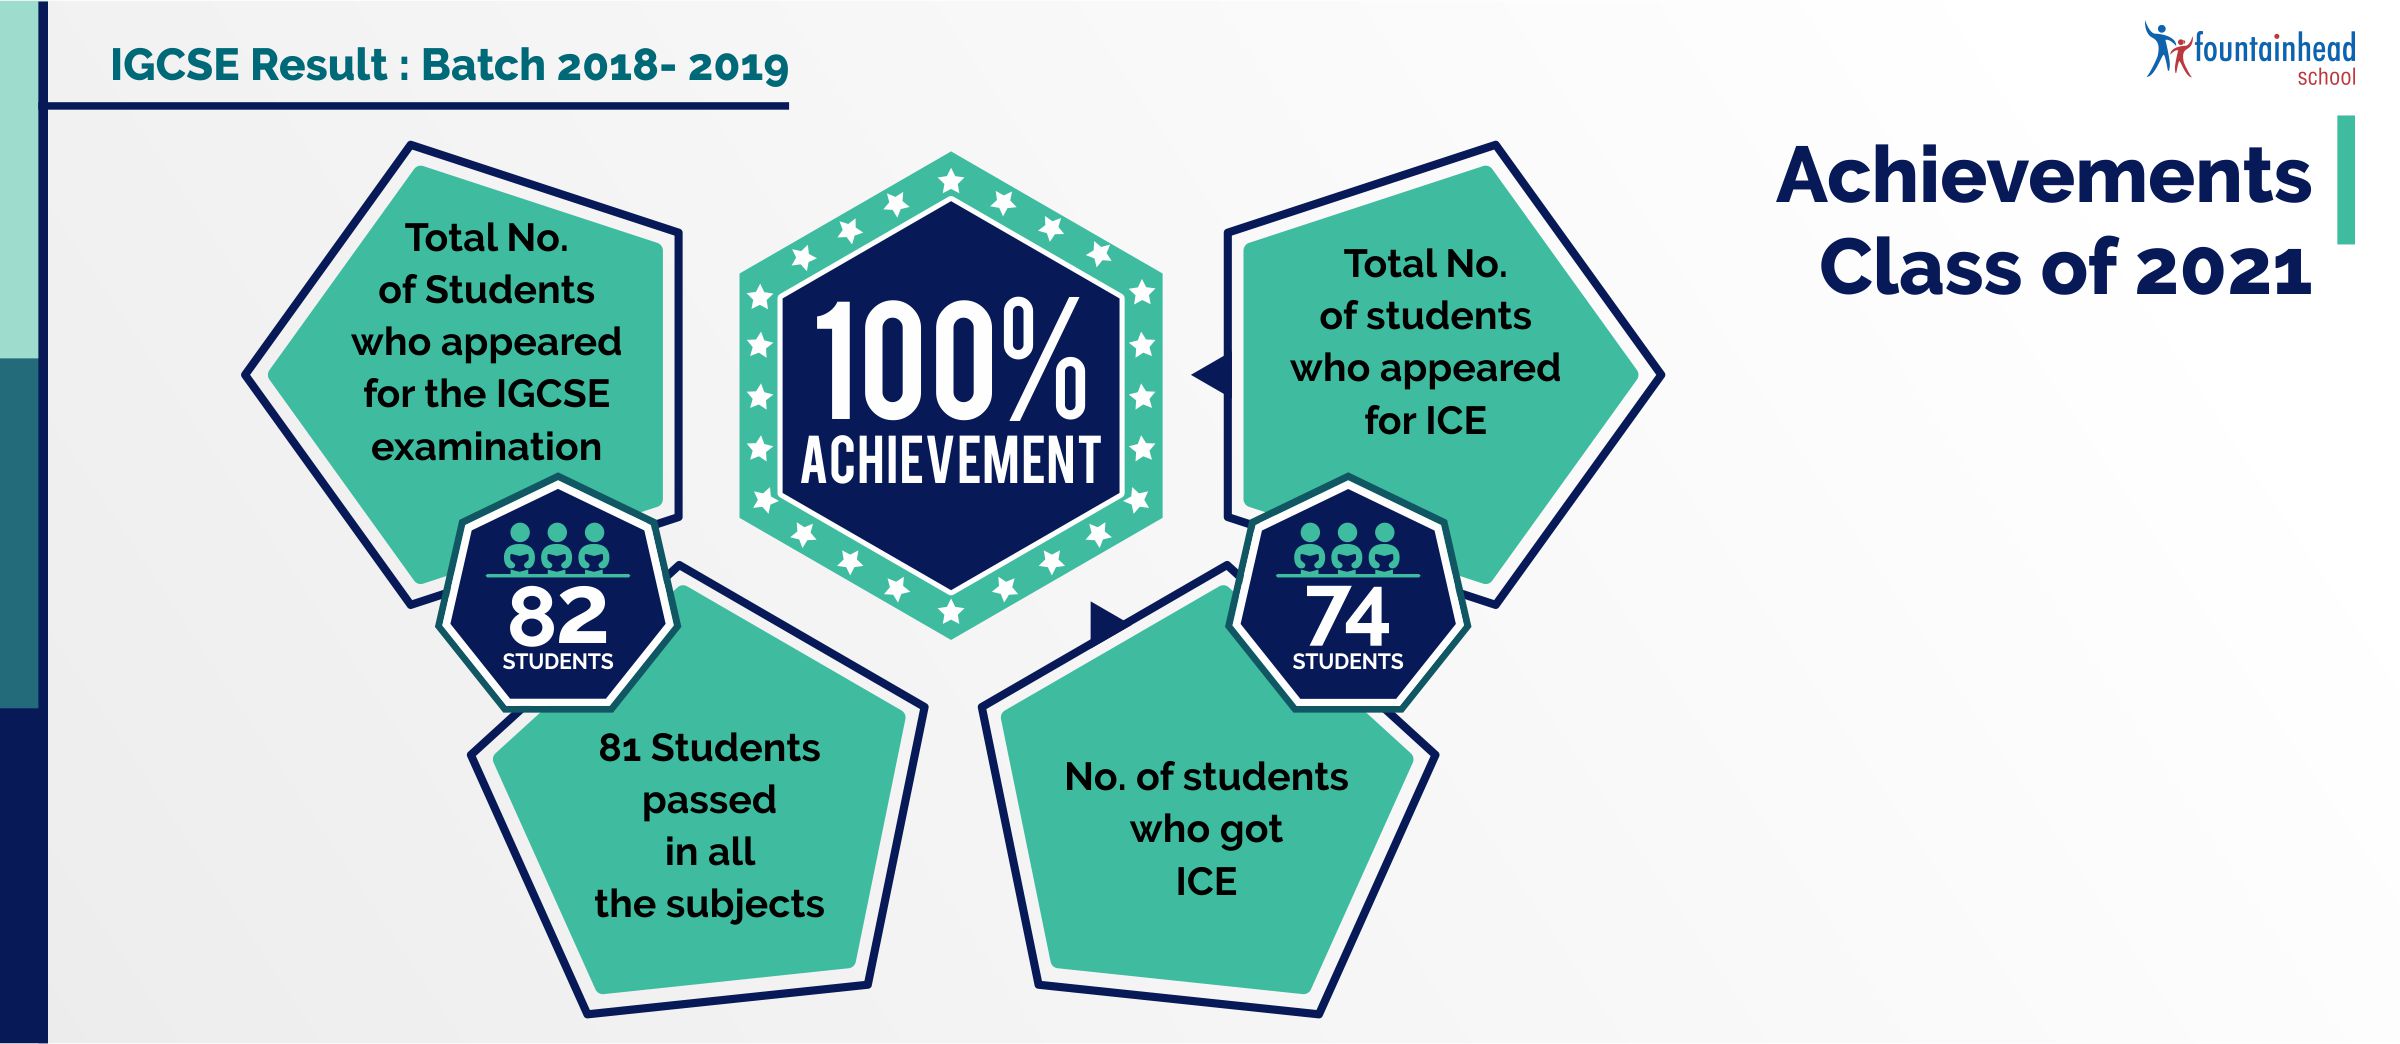
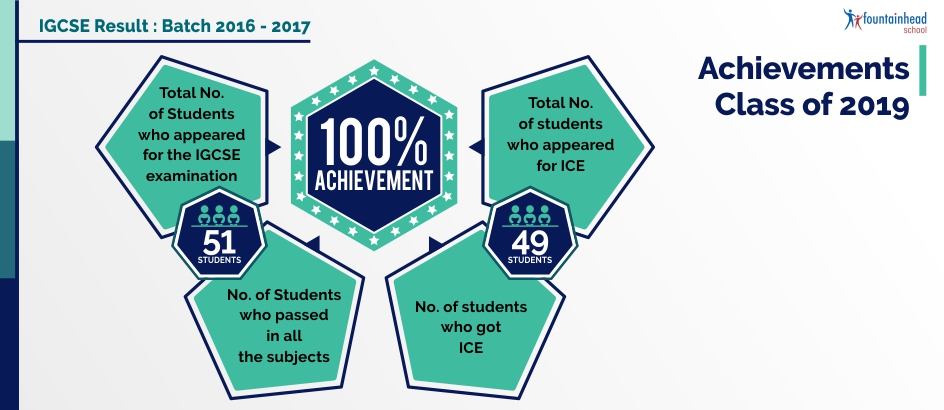
Total number of students who appeared for IGCSE exams |
82 |
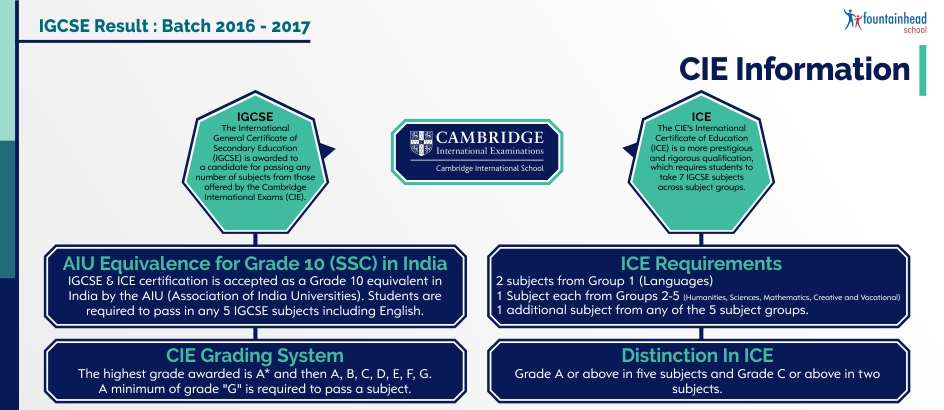
| No. of students who appeared for ICE and have received the ICE certificate (a more rigorous and prestigious award than the IGCSE; refer to Appendix 1 for details) | 74 out of 74 |
| No. of students who appeared for IGCSE (AIU equivalence for Class X: requires students to pass in 5 subjects including English) and have got AIU equivalence** (refer to Appendix 2 for details) |
7 out of 8 |
|
IGCSE Results over the years |
2015-2016 | 2016-2017 | 2017-2018 | 2018-19 |
|
Total No. of Students appeared for the IGCSE examination |
57 | 51 | 59 | 82 |
| No. of Students who passed in all the subjects | 57 | 51 | 59 |
81 |
|
ICE achievement % for given academic year |
96% | 100 % | 100% | 100% |
| No. of Students who got a distinction in ICE | 15 (27%) | 21 (43%) | 19 (35%) |
39 (53%) |
|
No. of Students who got a merit in ICE |
31 (57%) | 23 (47%) | 31 (56%) |
30 (41%) |
| No. of Students who got a pass in ICE | 9 (16%) | 5 (10%) | 5 (9%) |
5 (7%) |
- Majority of our students have got distinction and merit this year.
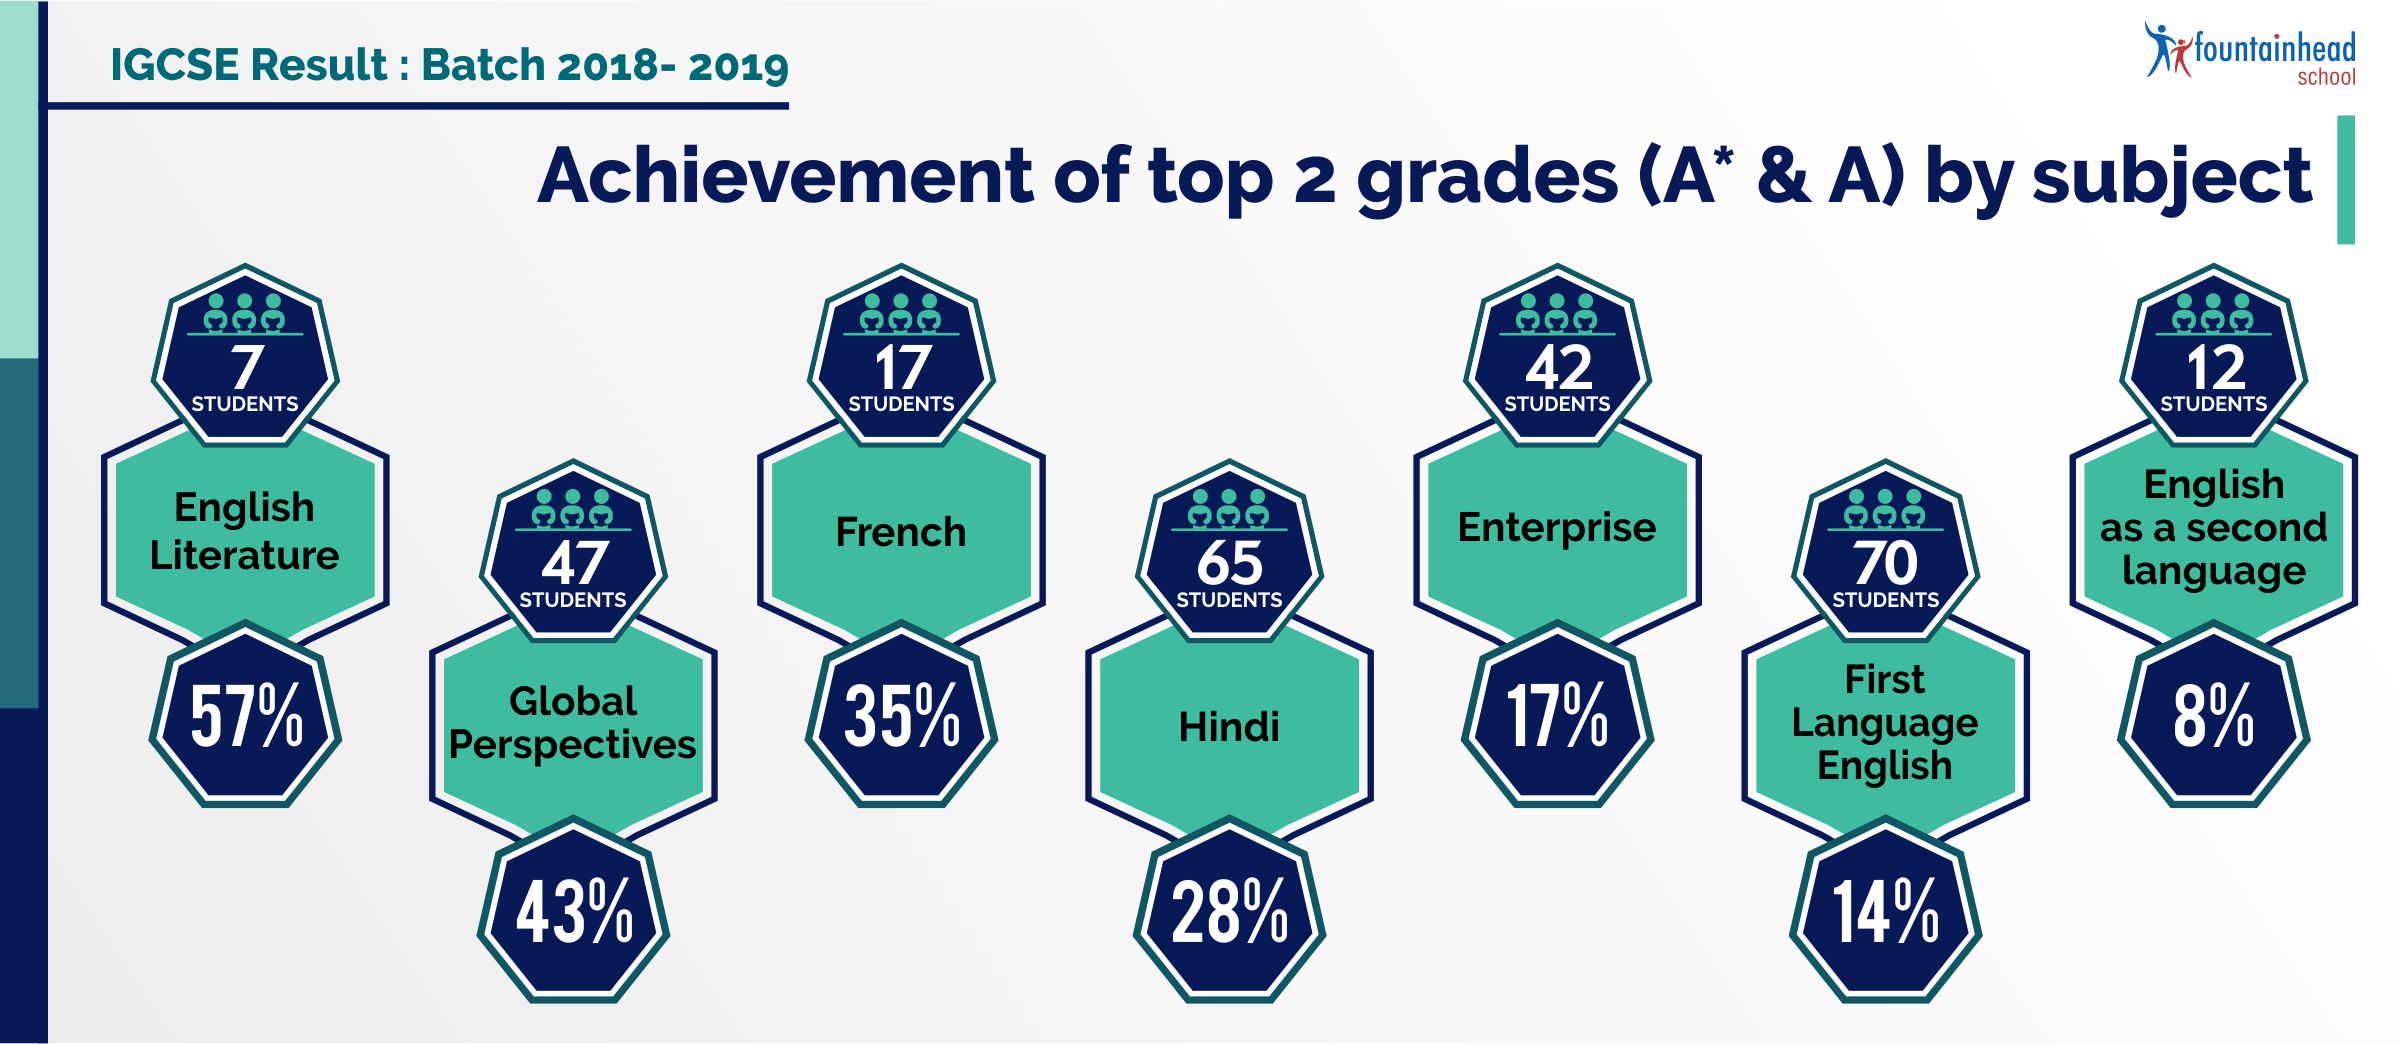
- Performance of students in First Language English has shown improvement. The number of students getting the top grades in English this year has increased as compared to last year. The table below clearly shows the student nos (in percentage) moving from grade “B” to “A”
| First Language English Student getting top 3 grades in 2 years (in percentage) | ||
|
Academic Year |
2017-18 | 2018-19 |
| No. of students | 56 | 70 |
| A* | 0 | 0 |
| A | 4 % | 14 % |
| B | 25 % |
21 % |

| Total number of students who appeared for IGCSE exams | 59 |
| No. of students who appeared for ICE and have received the ICE certificate (a more rigorous and prestigious award than the IGCSE; refer to Appendix 1 for details) | 55 out of 55 |
| No. of students who appeared for IGCSE (AIU equivalence for Class X: requires students to pass in 5 subjects including English) and have got AIU equivalence** (refer to Appendix 2 for details) | 3 out of 3 |
| No. of students who appeared for less than 5 subjects and have got the IGCSE certificate | 1 out of 1 |
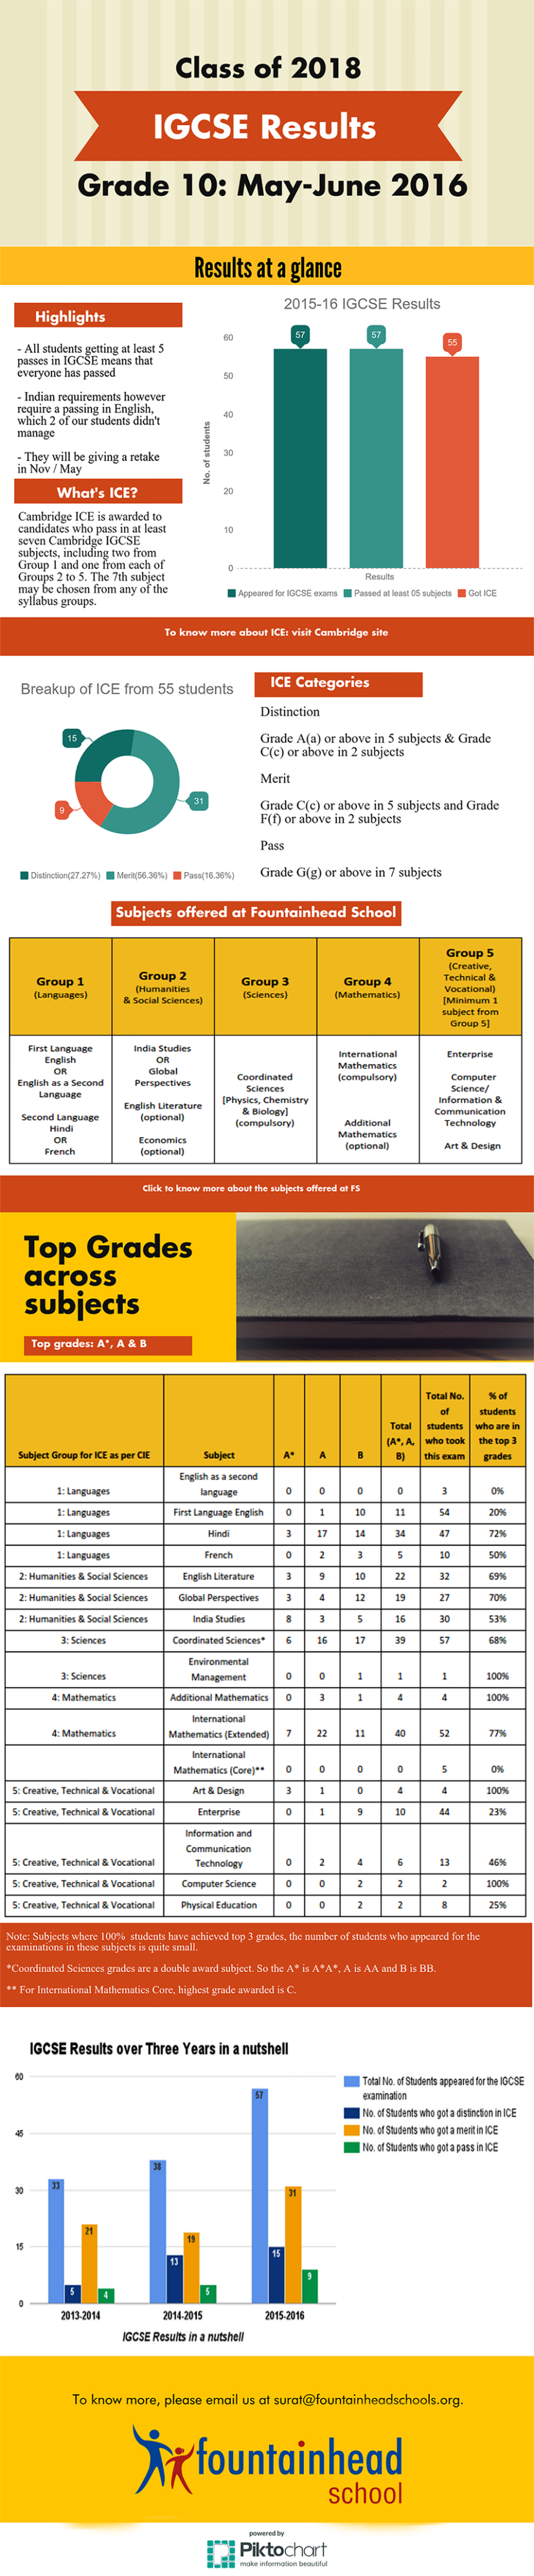
| IGCSE Results over the years | 2015-2016 | 2016-2017 | 2017-2018 |
| Total No. of Students appeared for the IGCSE examination | 57 | 51 | 59 |
| No. of Students who passed in all the subjects | 57 | 51 | 59 |
| ICE achievement % for given academic year | 96% | 100 % | 100% |
| No. of Students who got a distinction in ICE | 15 (27%) | 21 (43%) | 19 (35%) |
| No. of Students who got a merit in ICE | 31 (57%) | 23 (47%) | 31 (56%) |
| No. of Students who got a pass in ICE | 9 (16%) | 5 (10%) | 5 (9%) |
| Total No. of Students appeared for the IGCSE examination | 51 |
| IGCSE Achievement % | 100 % |
| No. of Students who passed in all the subjects | 51 |
| No. of students appeared for ICE (a more rigorous and prestigious award than the IGCSE) | 49 |
| No. of students who got ICE | 49 |
| ICE achievement % for 49 students | 100% |
| No. of Students who got a distinction in ICE | 20 (41%) |
| No. of Students who got a merit in ICE | 24 (49%) |
| No. of Students who got a pass in ICE | 5 (10%) |
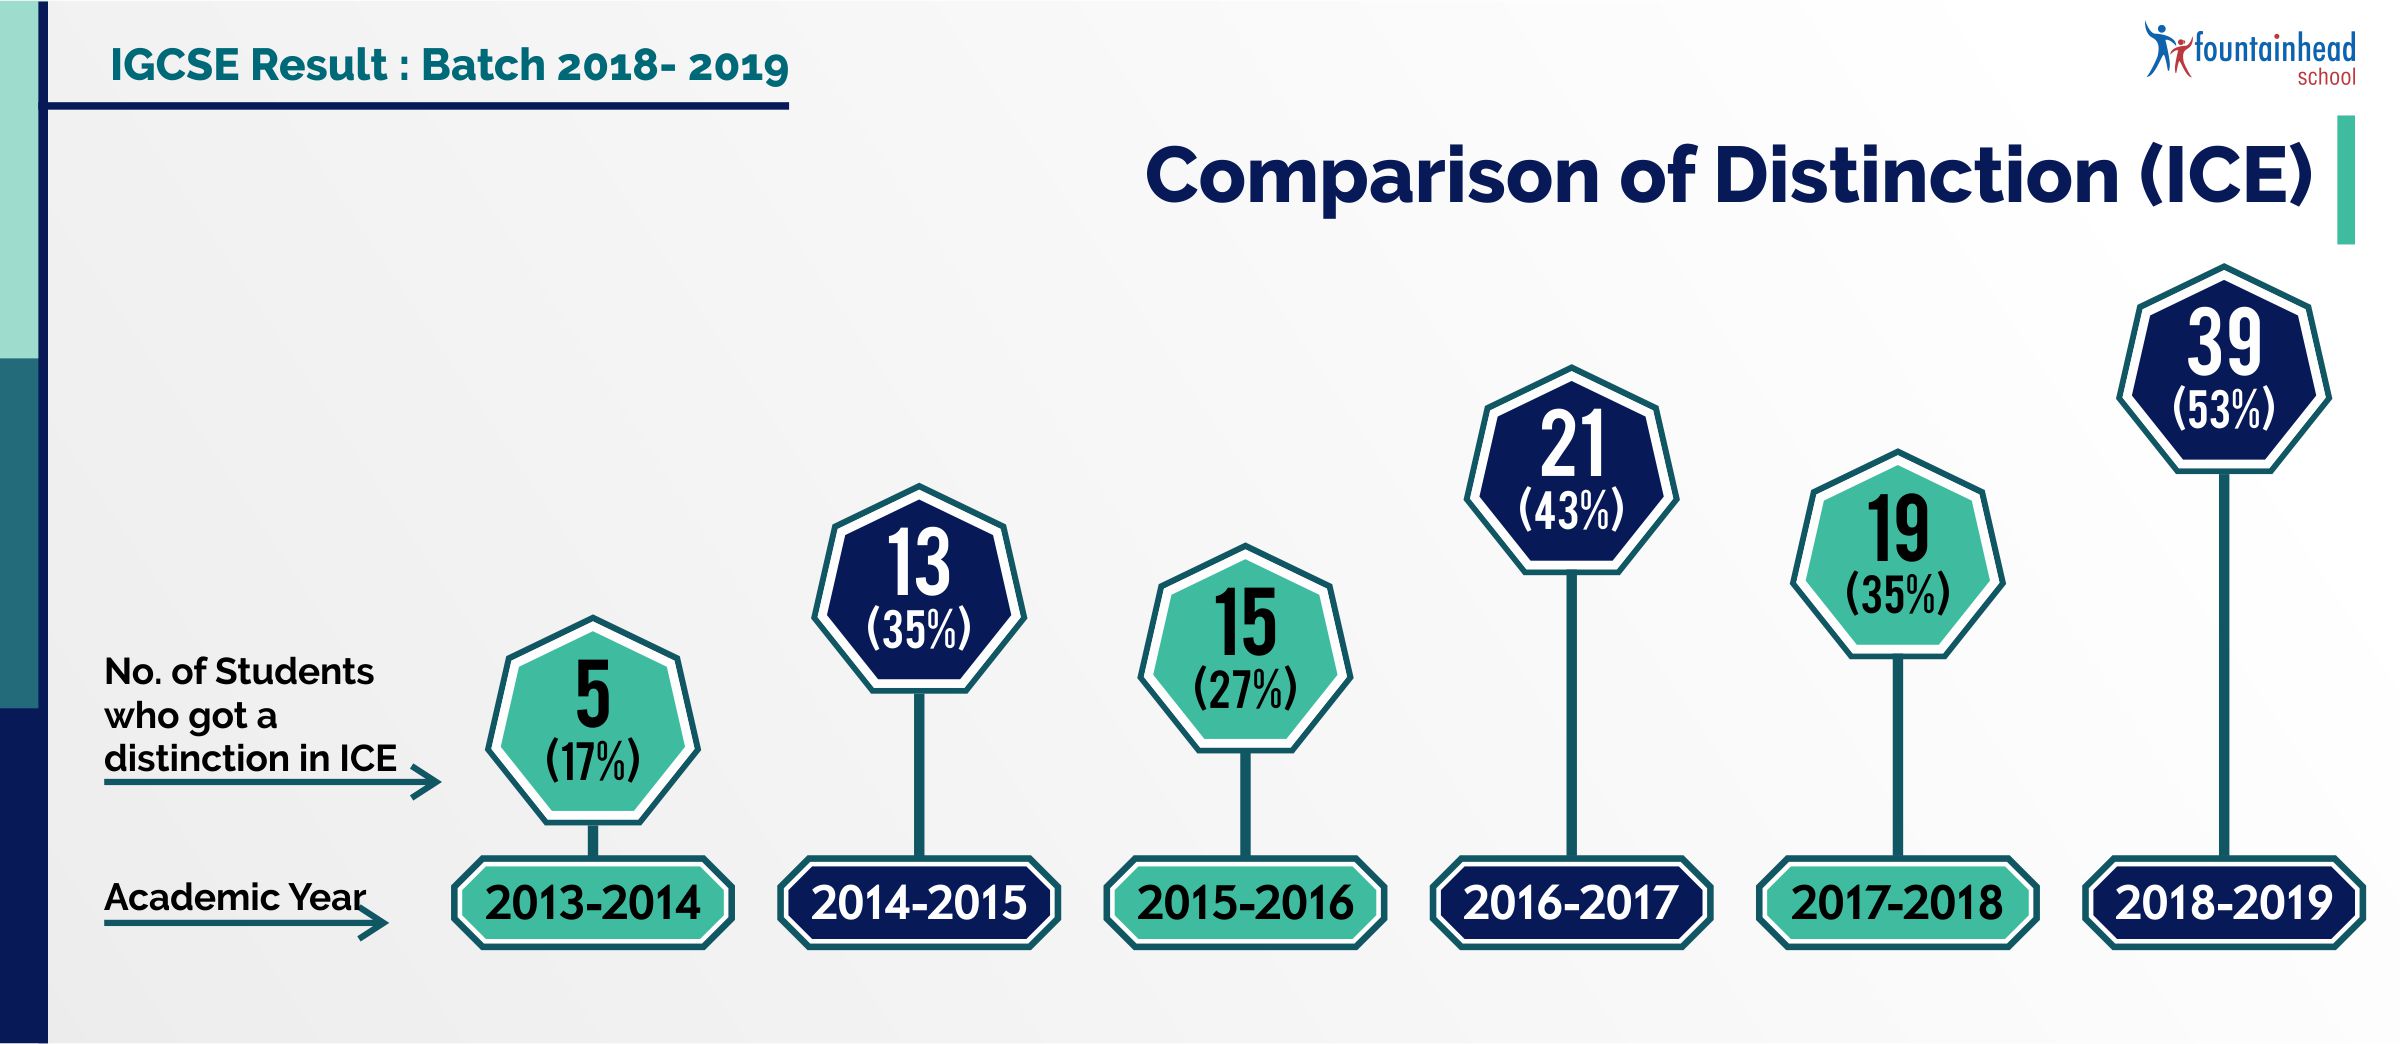
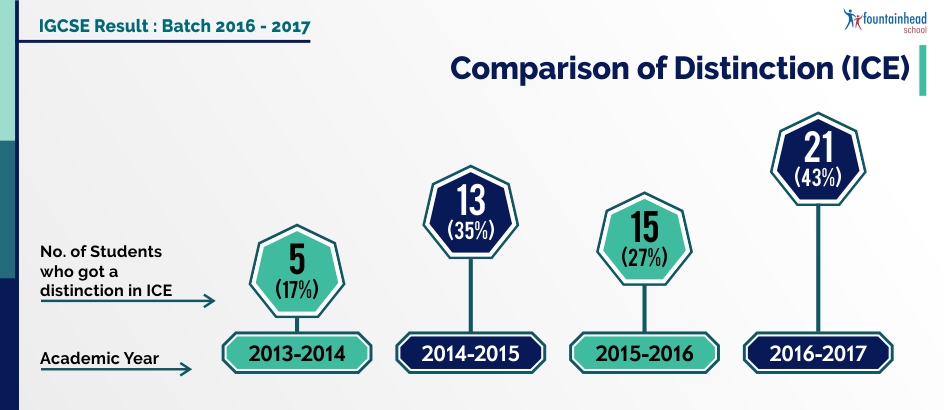
| IGCSE Results over the years | 2013-2014 | 2014-2015 | 2015-2016 | 2016-2017 |
| Total No. of Students appeared for the IGCSE examination | 33 | 38 | 57 | 51 |
| No. of Students who passed in all the subjects | 33 | 38 | 57 | 51 |
| ICE achievement % for given academic year | 91% | 97% | 96% | 100 % |
| No. of Students who got a distinction in ICE | 5 (17%) | 13 (35%) | 15 (27%) | 20 (41%) |
| No. of Students who got a merit in ICE | 21 (70%) | 19 (51%) | 31 (57%) | 24 (49%) |
| No. of Students who got a pass in ICE | 4 (13%) | 5 (14%) | 9 (16%) | 5 (10%) |

This was our third batch which has completed their IGCSE examinations and over the past 3 years, the results have been consistently good with the majority of students getting the more rigorous and prestigious ICE certificate.
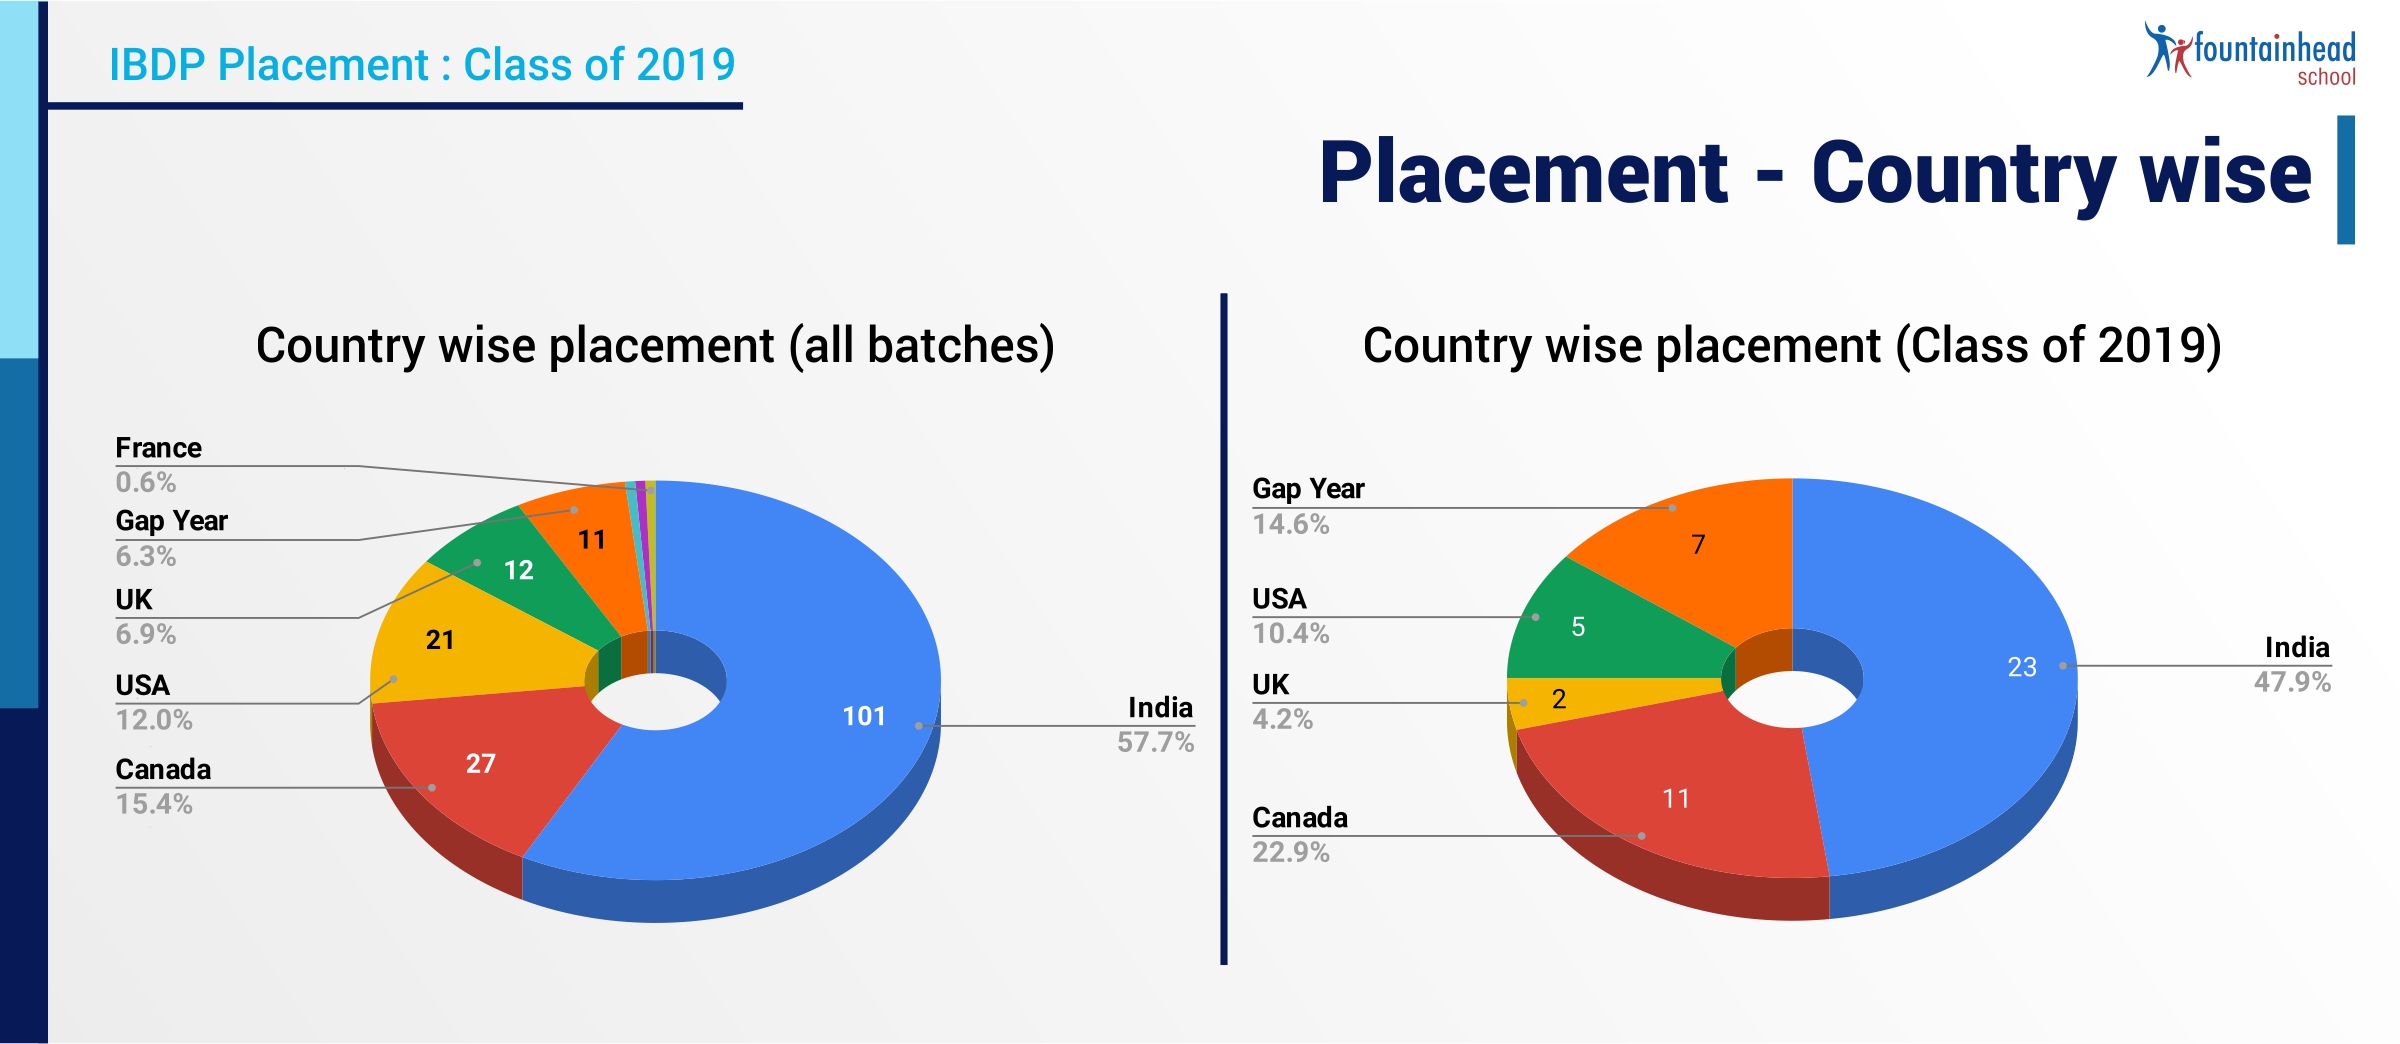
While more than 80% of our students have chosen to continue with the Diploma Program at Fountainhead School, the students who have left, have also got admissions in schools of their choice in Surat, India and abroad.
| IGCSE Results in a nutshell | |
| Total No. of Students appeared for the IGCSE examination | 38 |
| No. of Students who passed in at least 05 subjects | 38 |
| No. of students who got ICE (description is given below) | 37 |
| ICE achievement % for 37 students | 100% |
| No. of Students who got a distinction in ICE | 13 (35% students) |
| No. of Students who got a merit in ICE | 19 (51% students) |
| No. of Students who got a pass in ICE | 5 (13% students) |
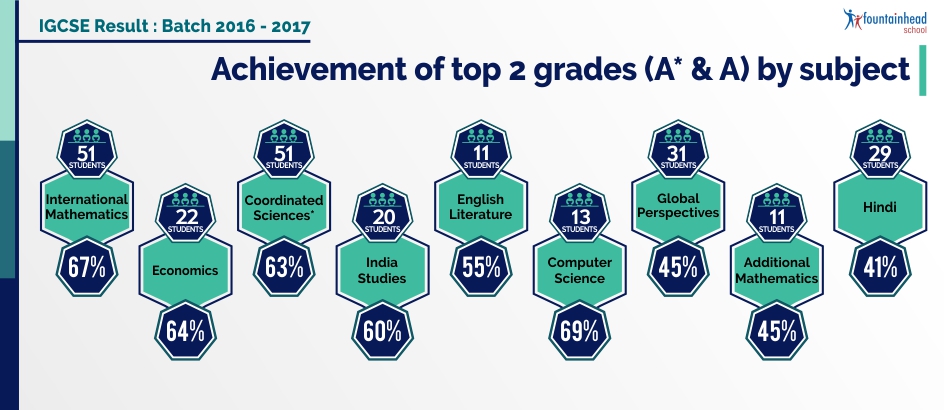
| Subject Group for ICE as per CIE | Subject | A* | A | B | Total No. of students who took this exam | % of students who are in the top 3 grades |
| 1: Languages | English as a second language | 0 | 0 | 1 | 5 | 20% |
| 1: Languages | First Language English | 1 | 2 | 12 | 34 | 44% |
| 1: Languages | Hindi | 3 | 13 | 14 | 38 | 79% |
| 2: Humanities & Social Sciences | English Literature | 4 | 4 | 6 | 18 | 78% |
| 2: Humanities & Social Sciences | Global Perspectives | 1 | 9 | 3 | 16 | 81% |
| 2: Humanities & Social Sciences | India Studies | 5 | 4 | 6 | 20 | 75% |
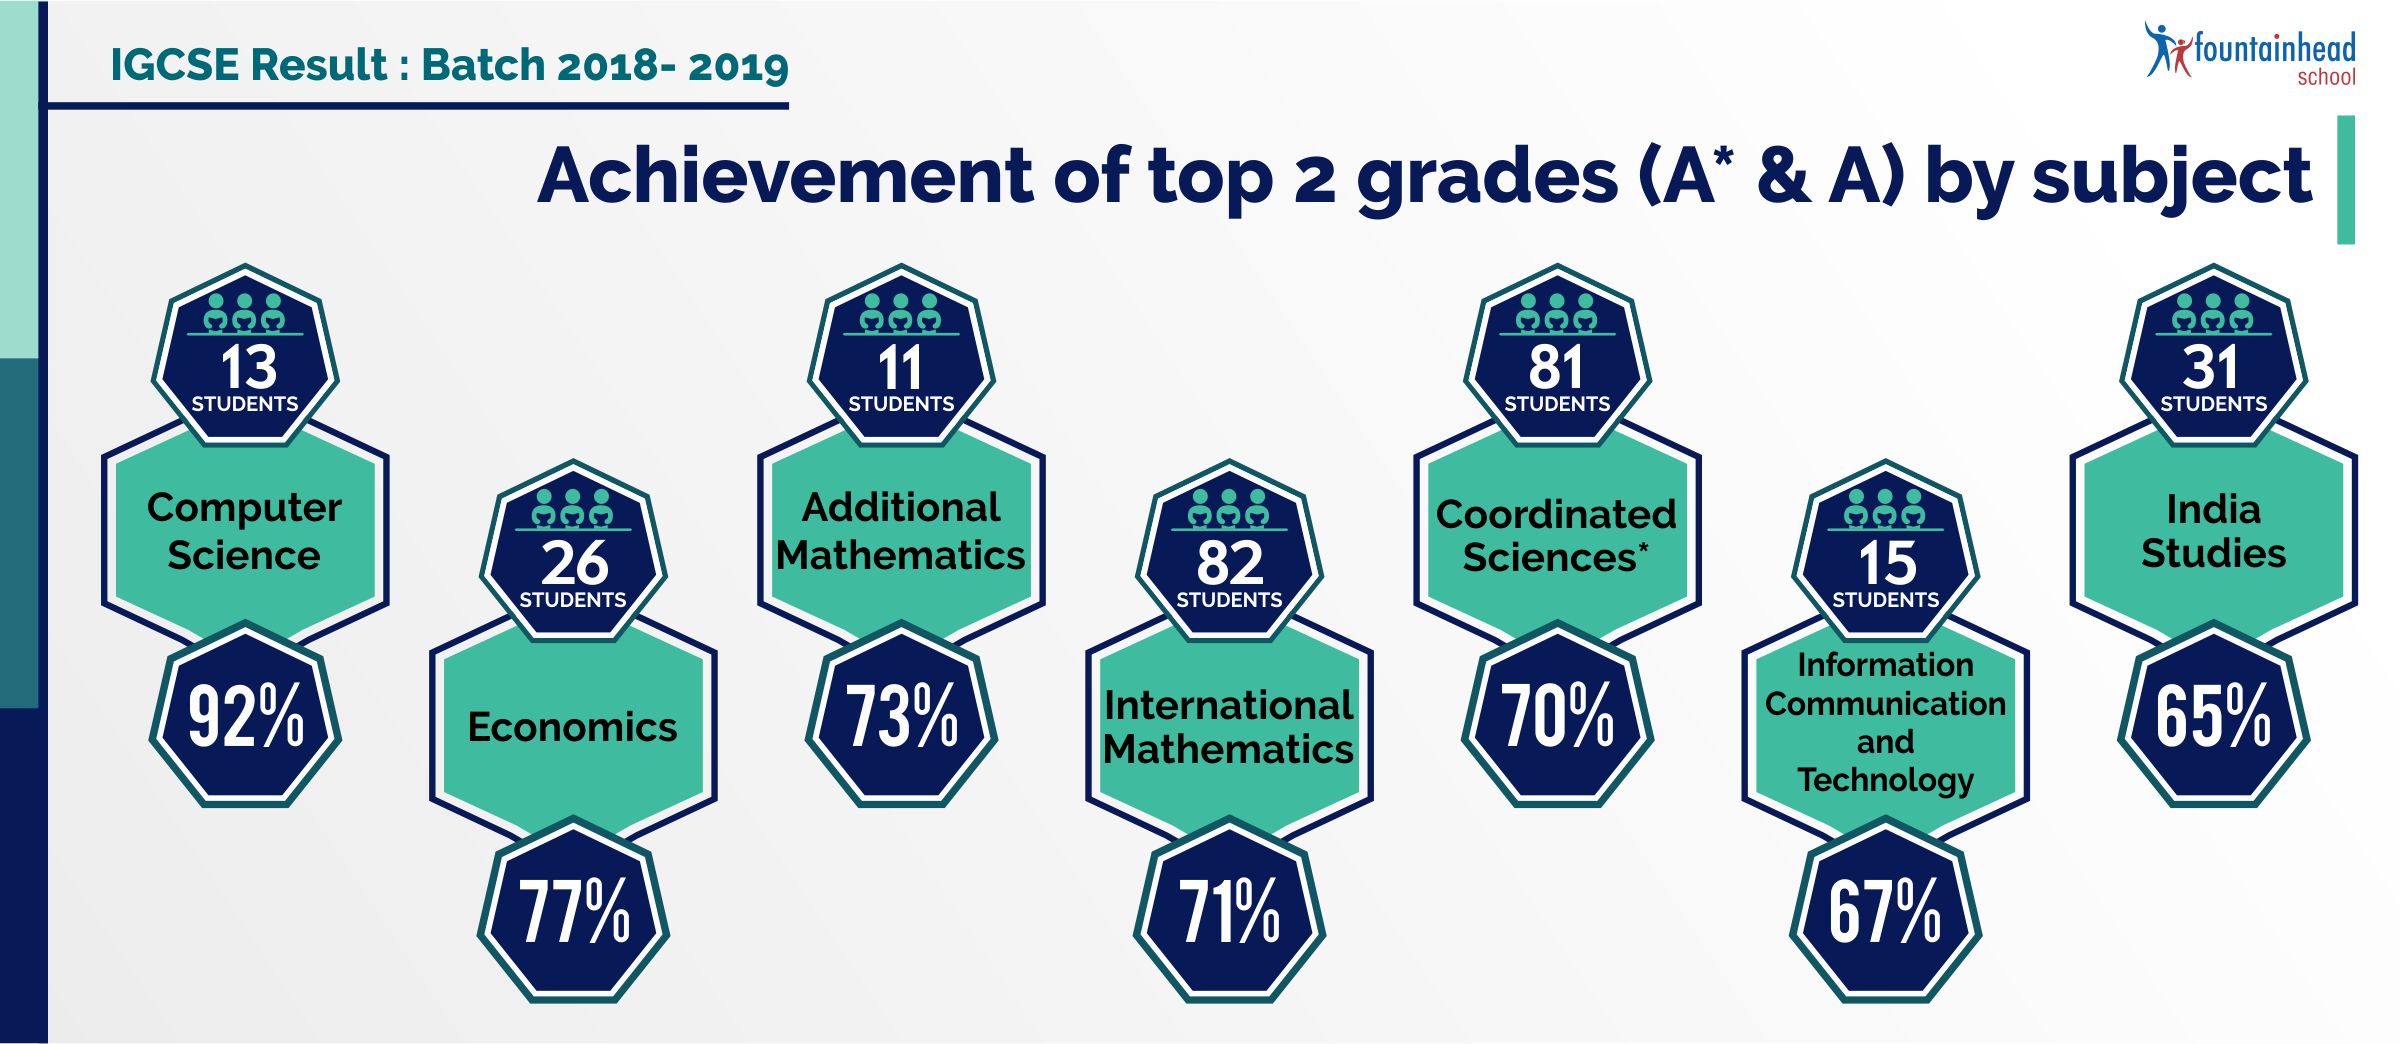
| 3: Sciences | Coordinated Sciences* | 7 | 14 | 4 | 32 | 78% |
| 3: Sciences | Environmental Management | 0 | 1 | 5 | 7 | 86% |
| 4: Mathematics | Additional Mathematics | 0 | 4 | 3 | 7 | 100% |
| 4: Mathematics | International Mathematics | 12 | 8 | 10 | 38 | 79% |
| 5: Creative, Technical & Vocational | Art & Design | 0 | 0 | 2 | 11 | 18% |
| 5: Creative, Technical & Vocational | Enterprise | 0 | 0 | 1 | 15 | 7% |
| 5: Creative, Technical & Vocational | Information Communication and Technology | 1 | 2 | 2 | 15 | 33% |
| 5: Creative, Technical & Vocational | Physical Education | 0 | 0 | 2 | 9 | 22% |
- Total No. of Students appeared for the IGCSE examination: 34
- No. of Students who passed in at least 05 subjects: 34
- No. of students who got ICE (description is given below): 30
- ICE achievement percentage: 88%
- No. of Students who got distinction in ICE: 05
- No. of Students who got merit in ICE: 21
- No. of Students who got a pass in ICE: 04
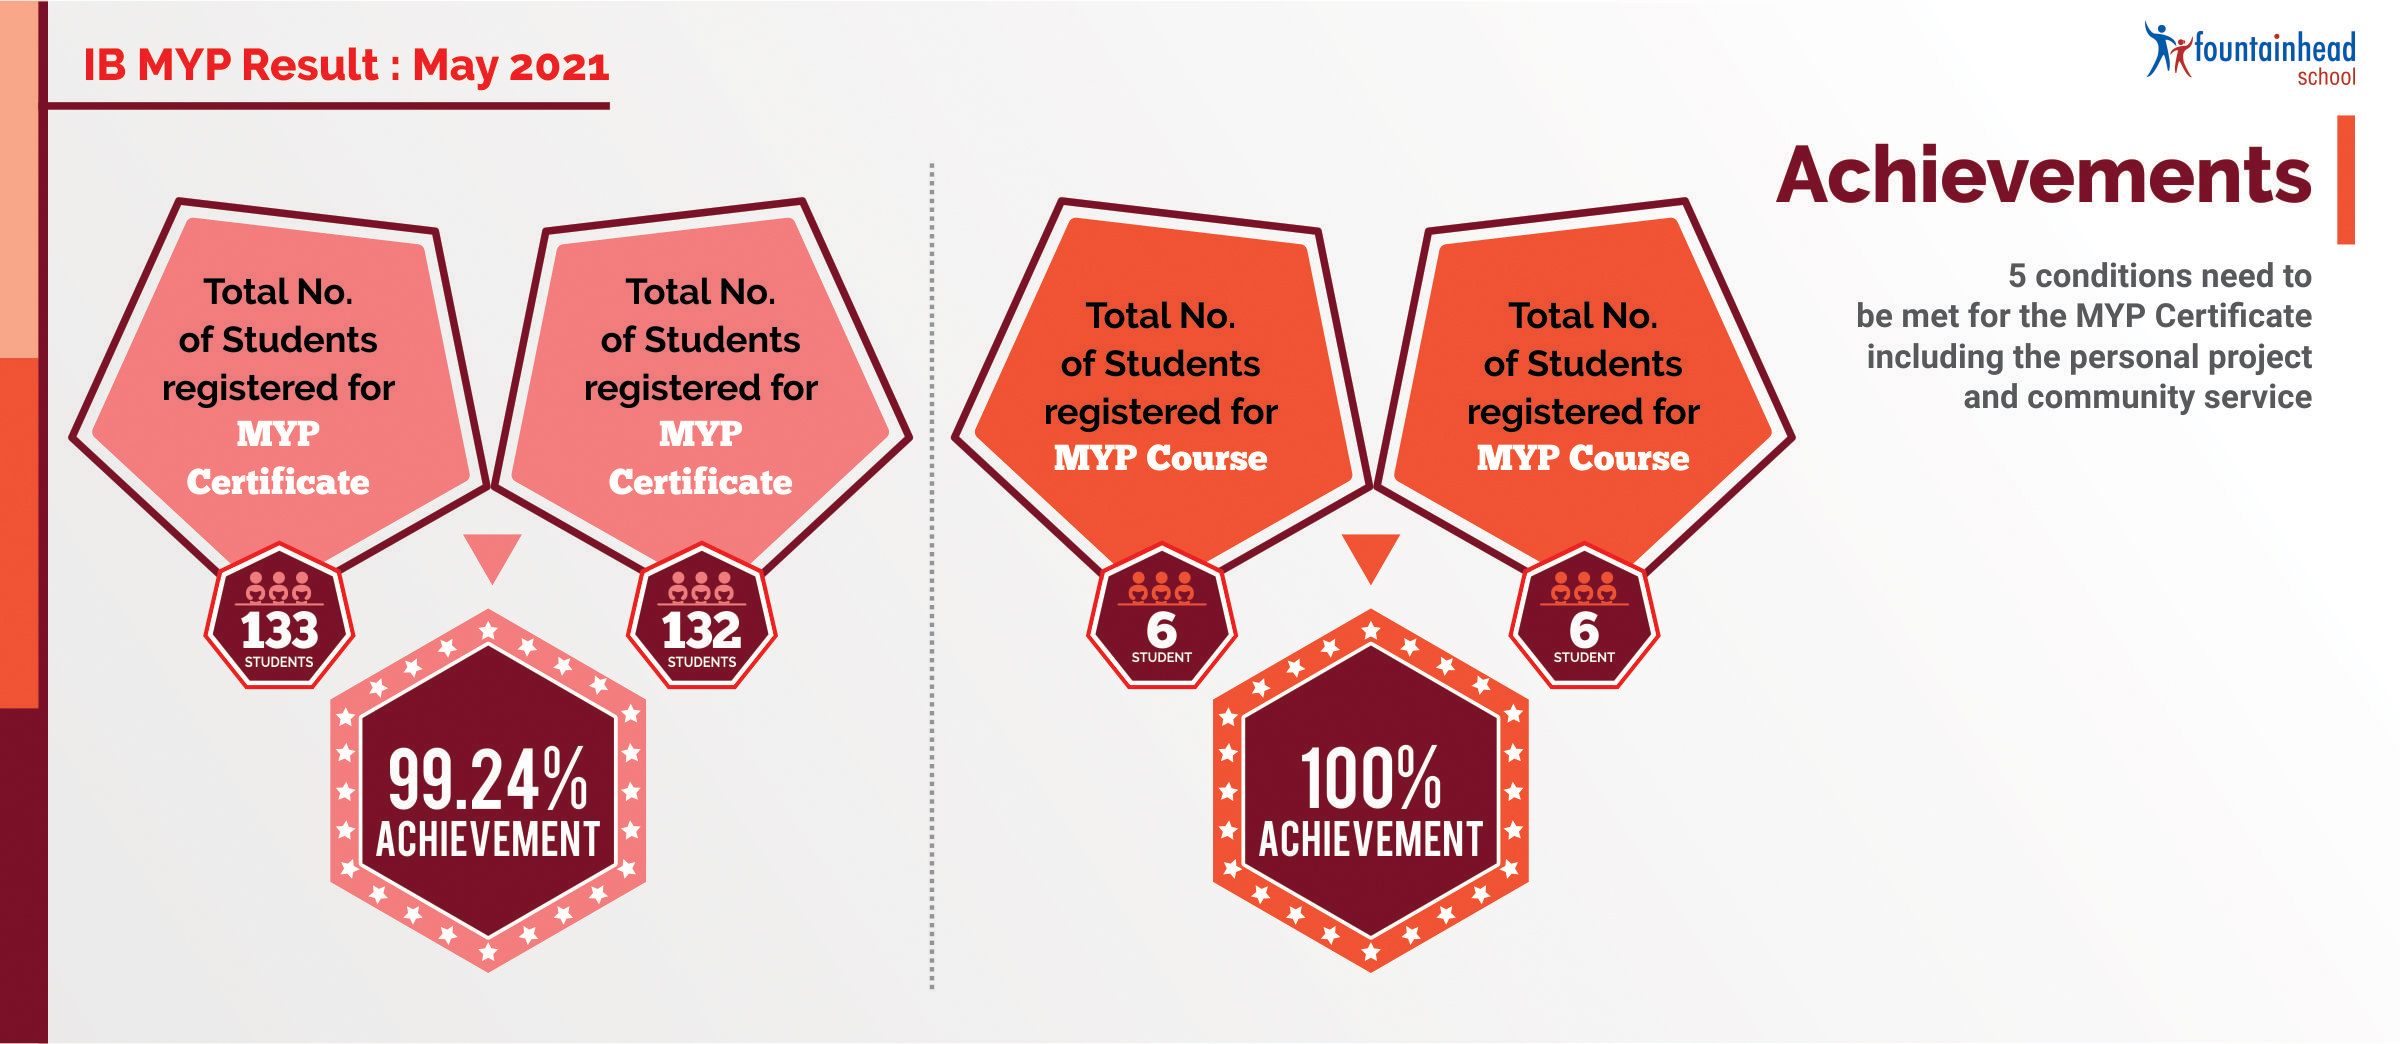
This is our first MYP batch that has appeared for e-assessments this year. MYP e-assessments are unique as they assess conceptual understanding, knowledge, and skills in unfamiliar situations. So the results speak for both academic achievements as well as conceptual understanding of the students.
While the MYP certificate is the pathway for students who register for all 8 subjects, the MYP course is opted by students who choose to appear for specific subjects in the MYP, rather than all the 8 subjects.
Owing to the pandemic situation, IB assessed students for English, Maths, Integrated Sciences, Integrated Humanities, and the Interdisciplinary unit through Alternate Tasks. Alternate tasks were a subset of onscreen exams. The final grades achieved for these subjects are based on student performance in Alternate tasks.
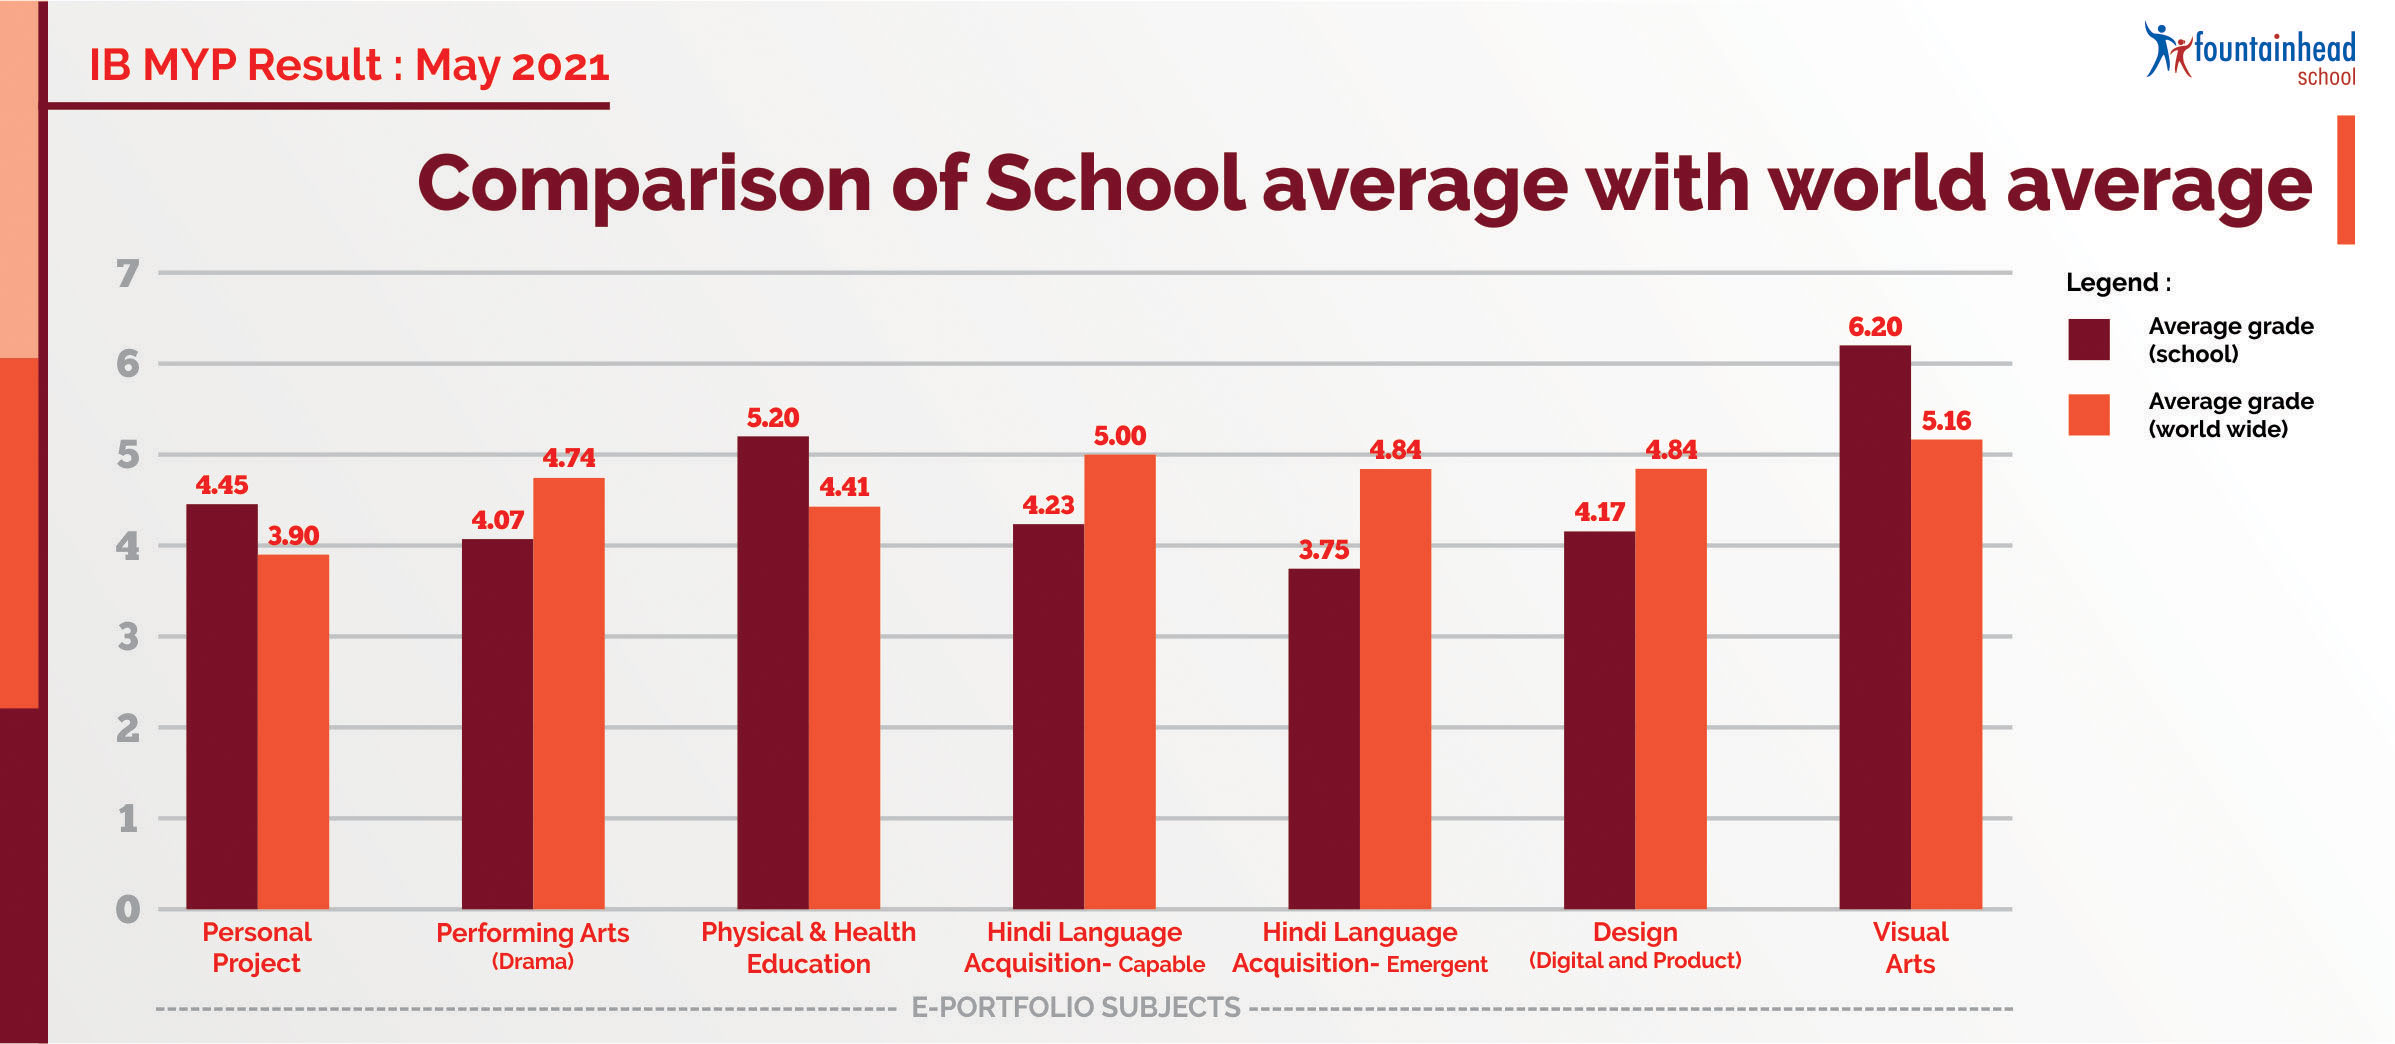
Language Acquisition (Hindi), Personal Project, and Physical & Health Education / Visual Arts/ Performing Art- Drama / Digital Design / Product Design (students choose one of these) are graded through e-portfolios which are internally assessed by subject teachers and externally moderated by IB examiners.

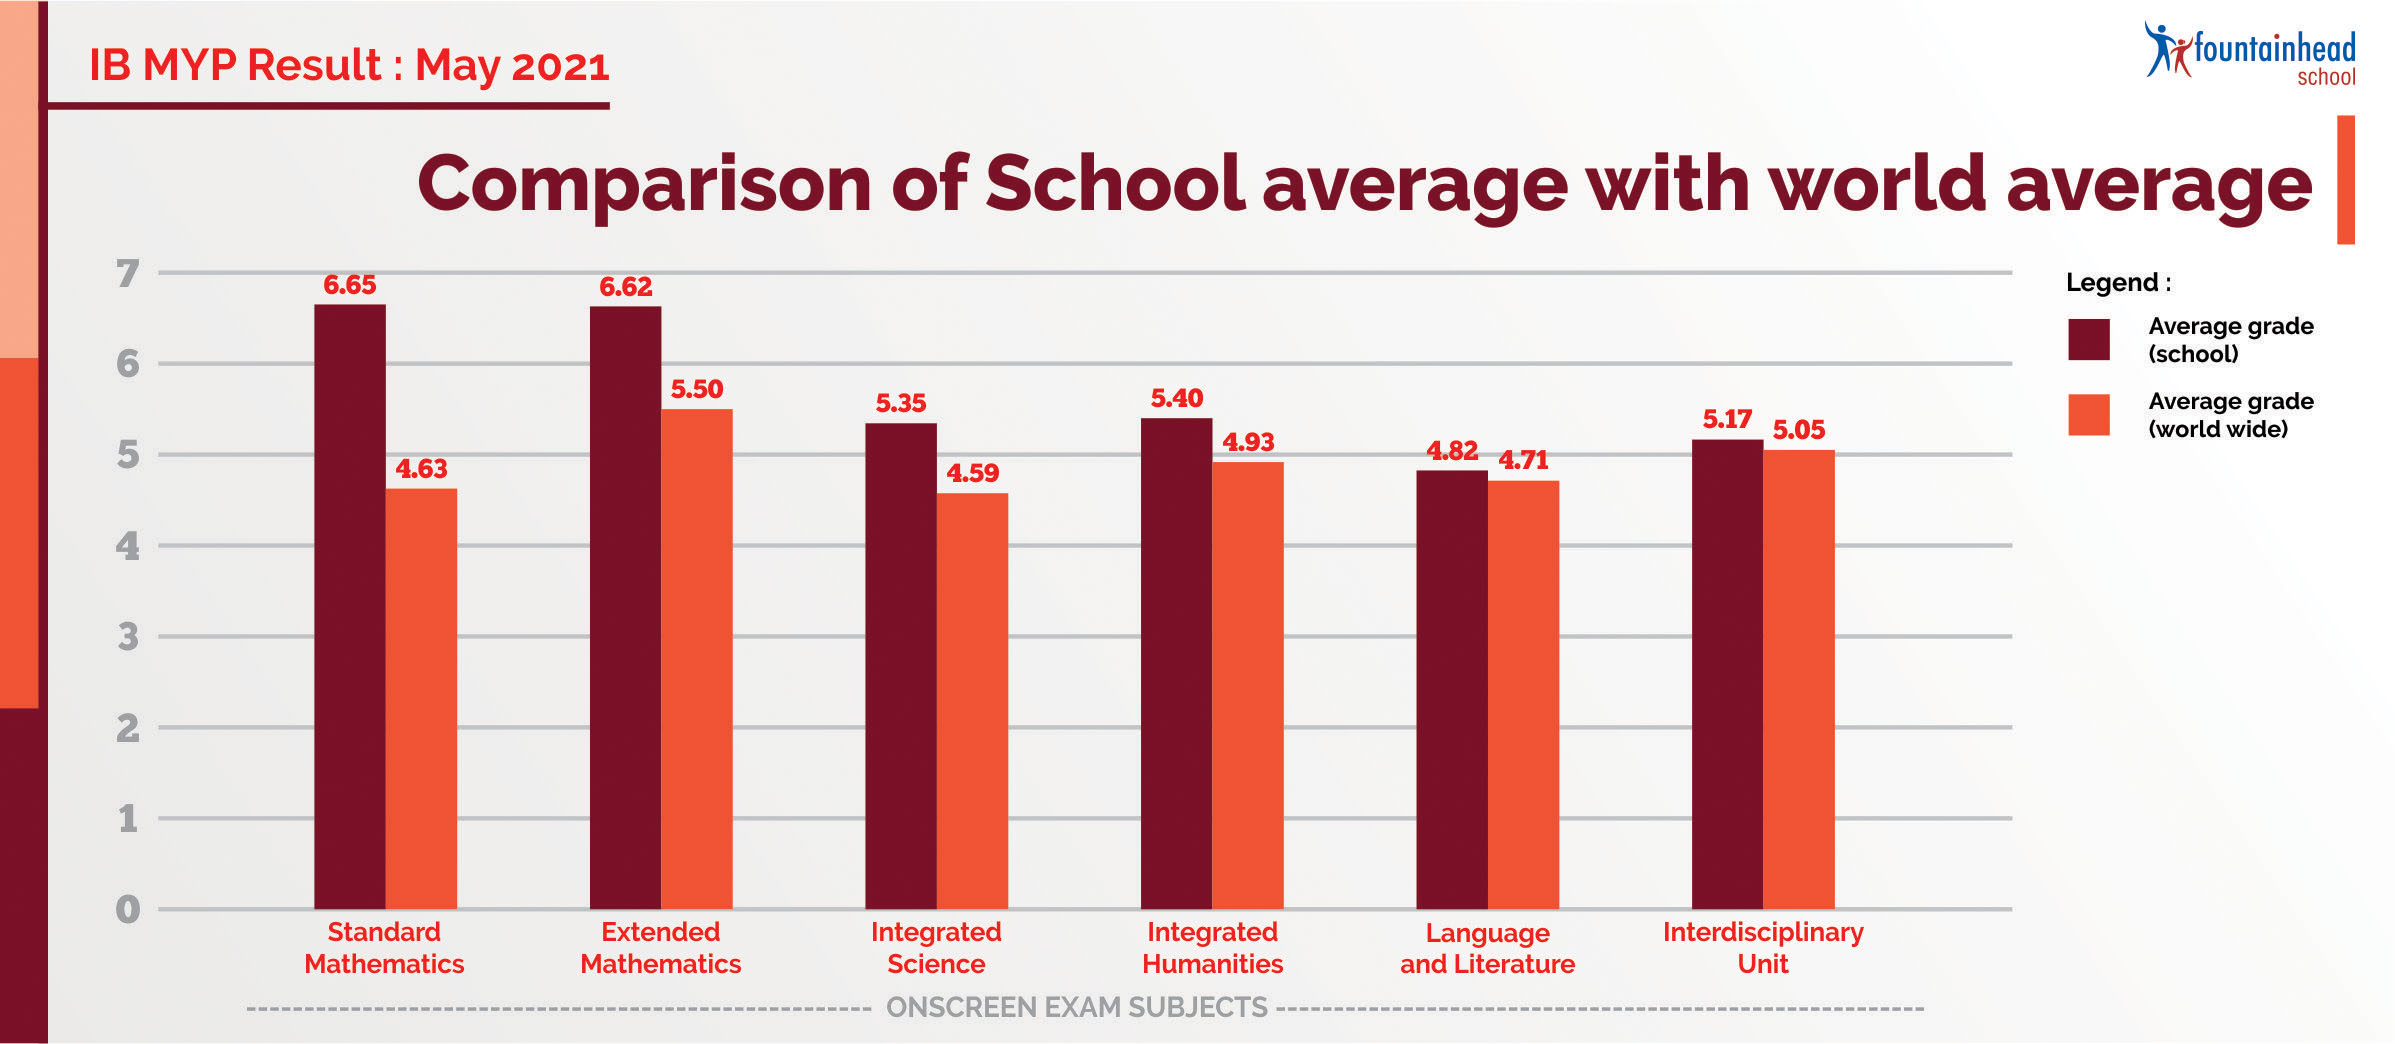
Owing to the pandemic situation, IB canceled the on-screen examinations for English, Maths, Integrated Sciences, Integrated Humanities, and Interdisciplinary units. The grades for these subjects are the same as predicted grades given by the school based on student performance in mock exams and previous years.
The remaining 3 subjects, Language Acquisition (Hindi), Personal Project and Physical & Health Education / Arts / Digital Design / Product Design (students choose one of these) are graded through e-portfolios which are moderated by the IB (as is done in the normal scenario) after the checking done by school teachers.
MYP certificate is the pathway for students who appear for on-screen examinations for all 8 subjects. MYP course is a pathway where students choose to appear for specific subjects in the MYP, rather than all the 8 subjects.

DP students have two types of assessments under normal circumstances which are called the Exam route. These include:
-
External assessment (written examinations), English HL essay, Extended essay, TOK essay, Arts portfolio
-
Internal assessments (research and non-research-based submissions with specific word count or pages prescribed by the IB). Students have to submit their internal assessment to IB which is assessed by school teachers and moderated by IB while external assessment is completely assessed by IB.
The Non-exam route was made available to schools in India due to the pandemic situation and in this case, there were no written examinations conducted by IB, and all internal assessments were assessed by IB, unlike the exam route. That means all Internal Assessments were now externally assessed by IB examiners. The final grades were based on this as well as the school’s predicted grades. We ensured that students did their best in their IAs, and that each student got the predicted grade that they most deserved based on their performance over 2 years. The results of these efforts show up a significant increase in the average score.


 Class of 2020 Results at a glance
|
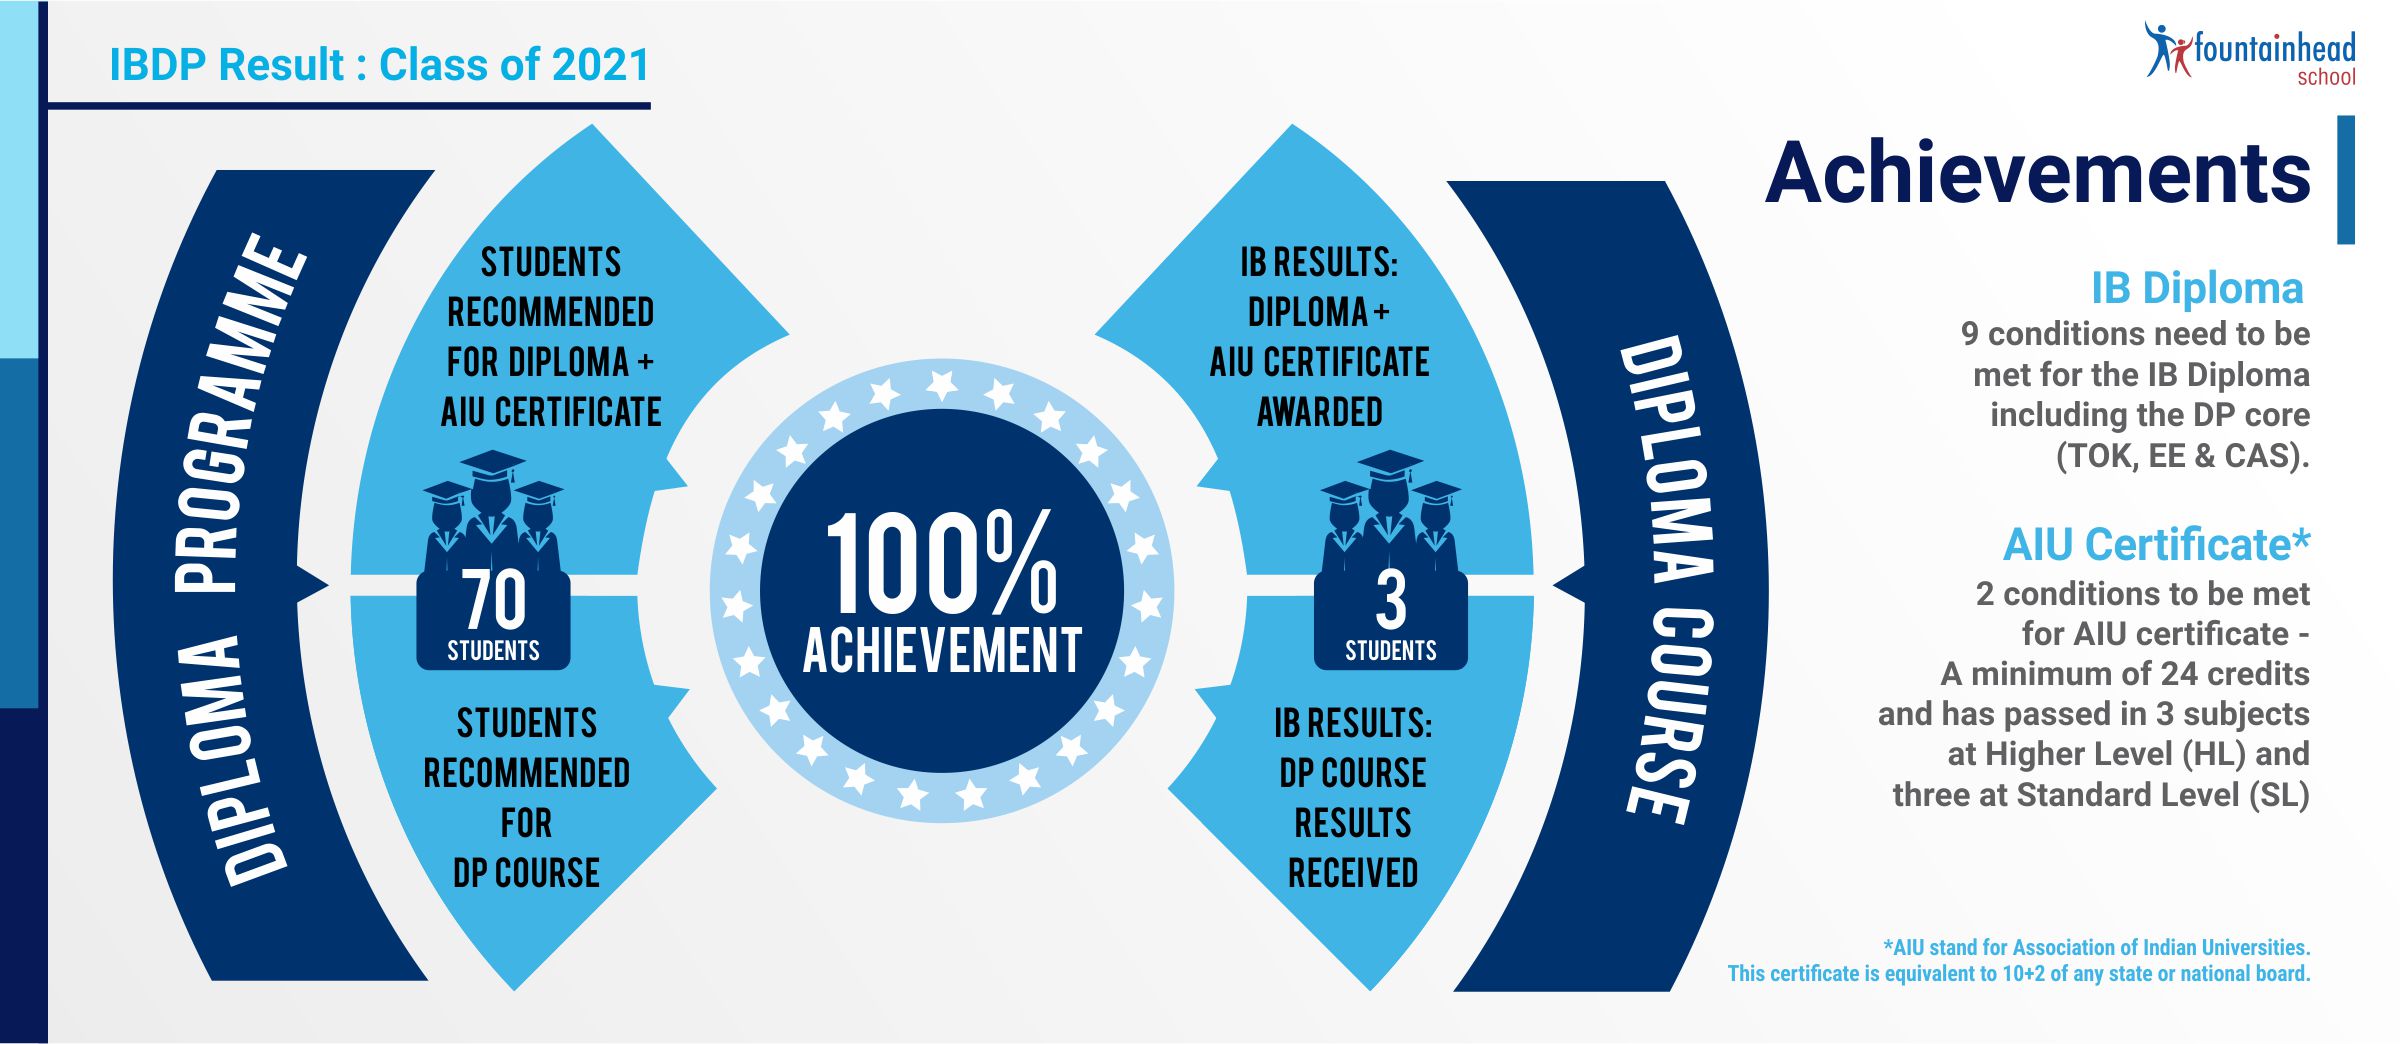
Students recommended for Diploma + AIU Certificate |
IB Results: Diploma + AIU Certificate Awarded |
% |
|
49 |
49 | 100% |
| Students recommended for DP course | IB Results: DP Course results received |
% |
|
6 |
6 |
100% |
|
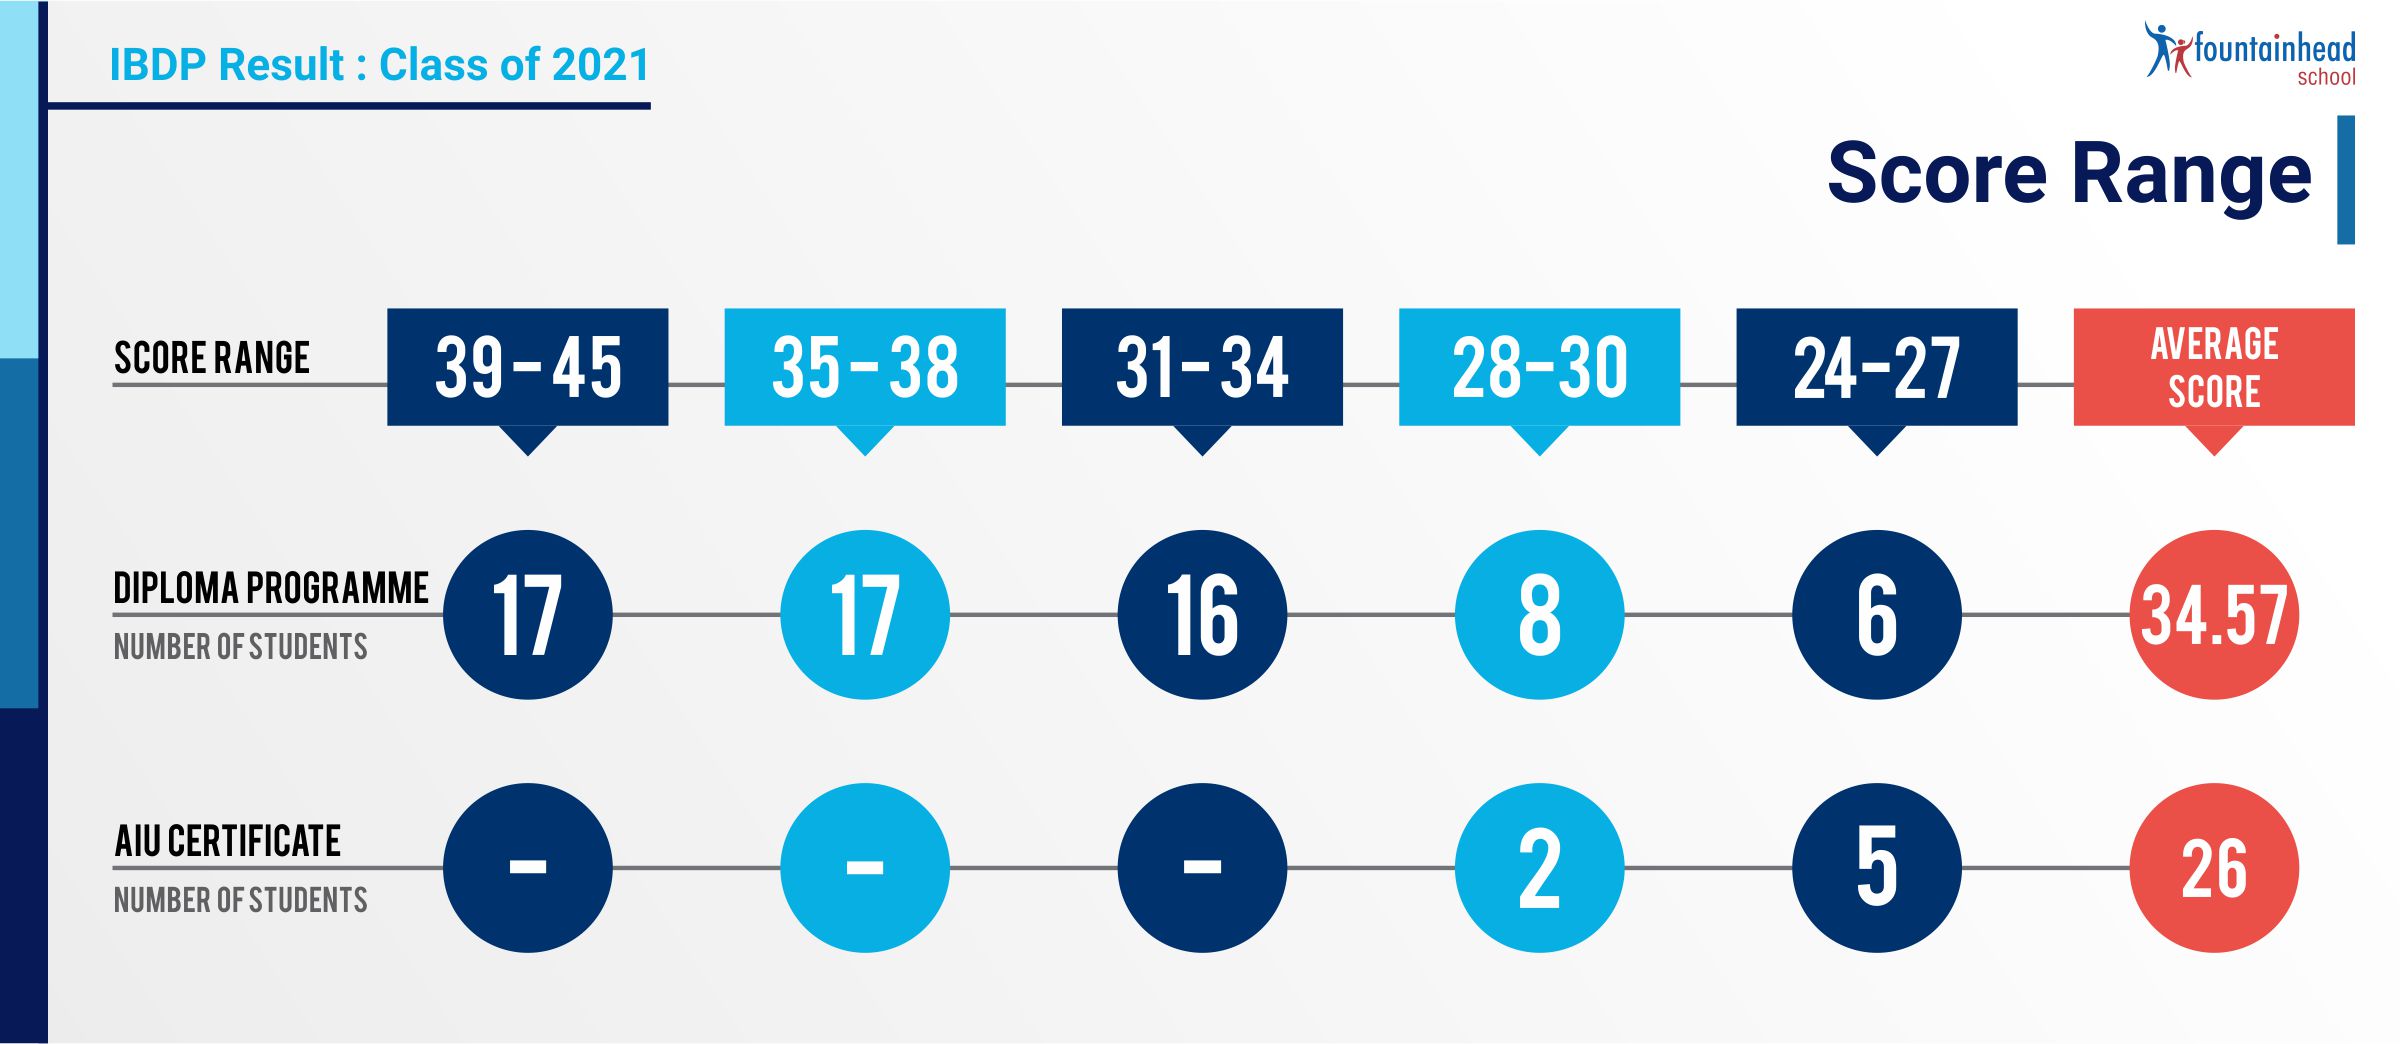
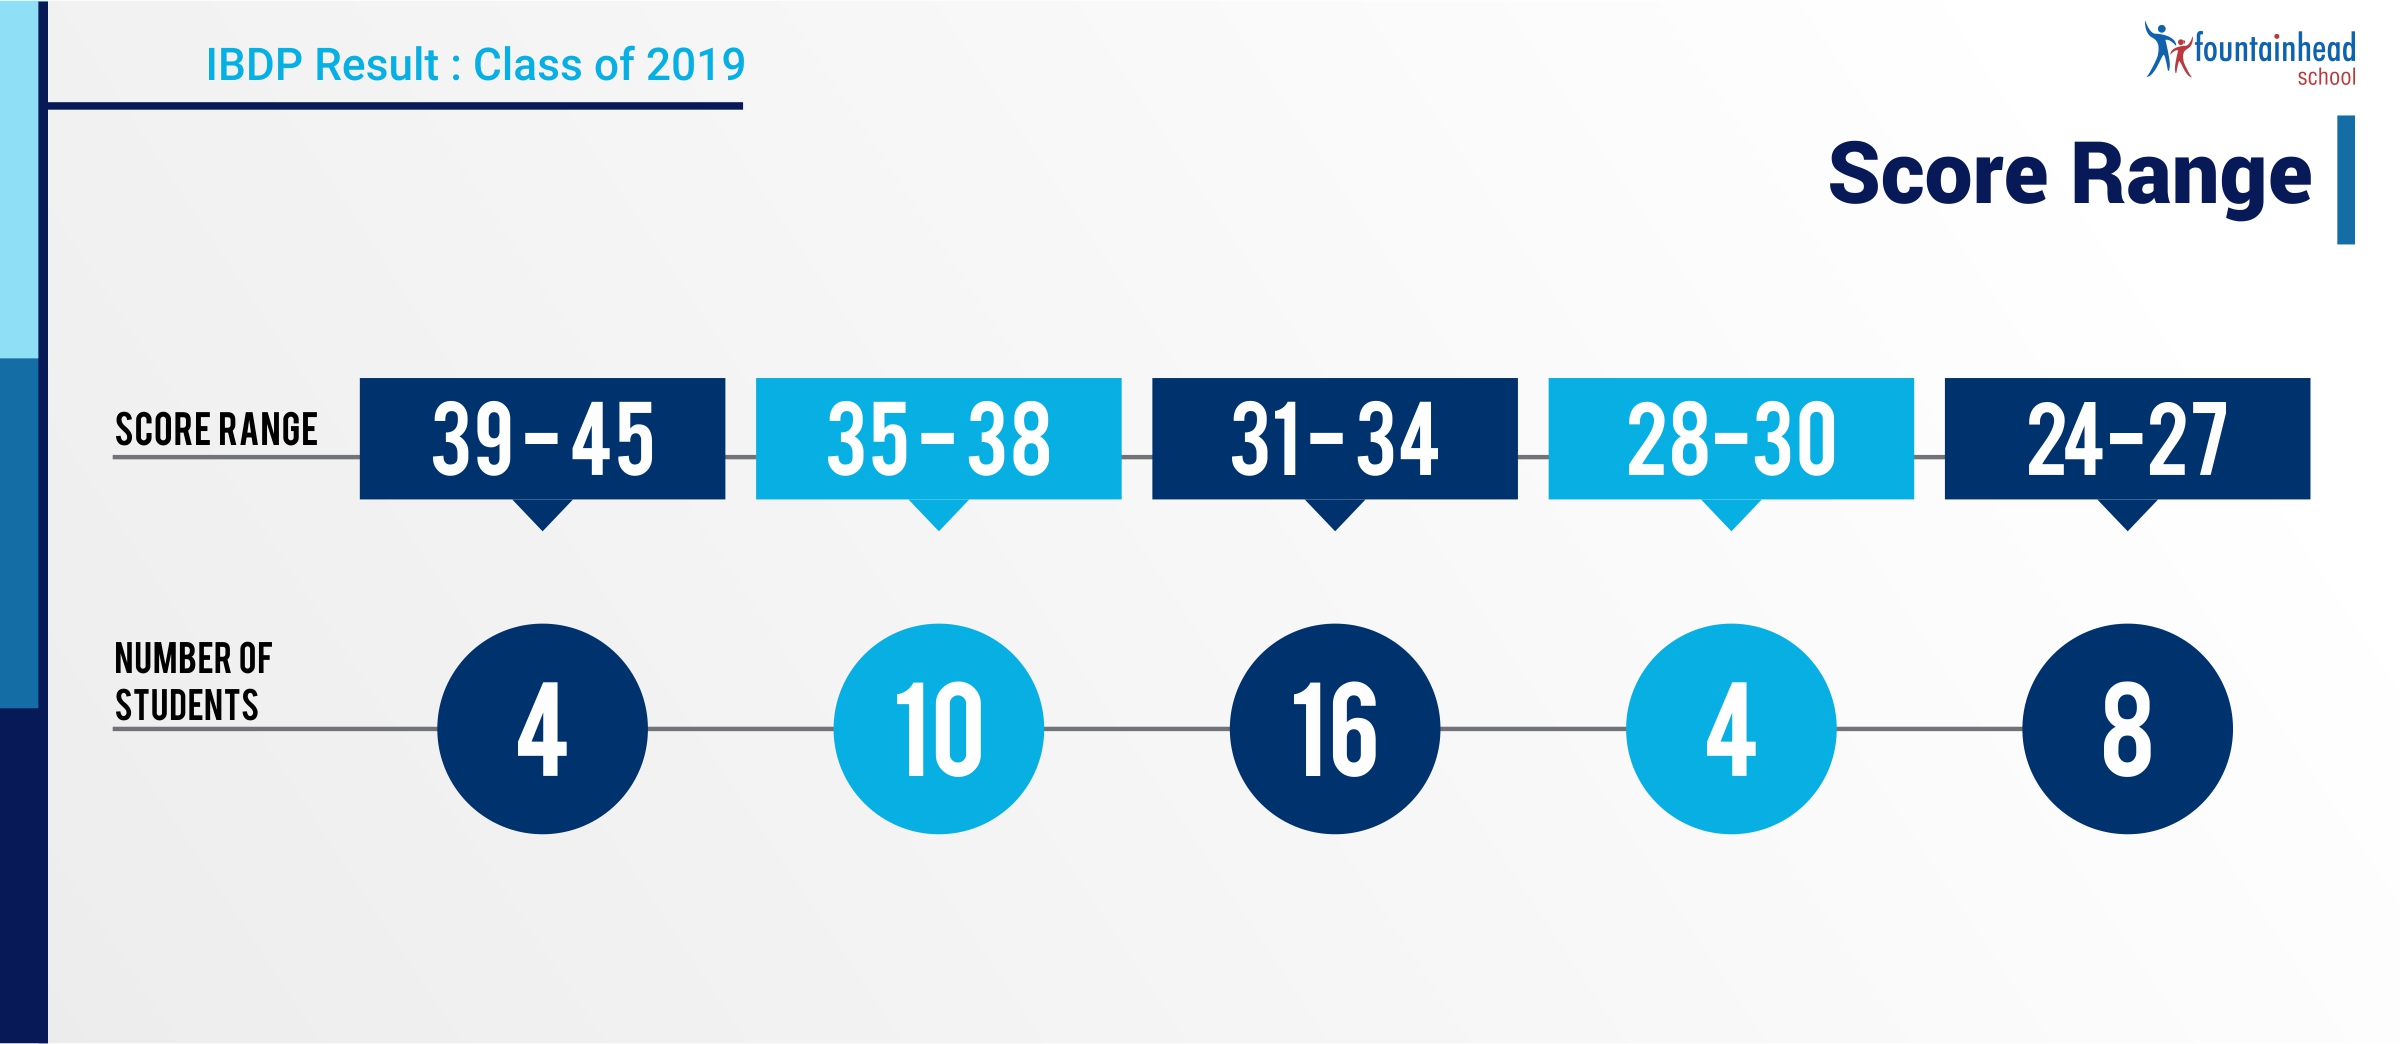
DP Score Range |
Class of 2020 Full DP | Class of 2020 AIU |
| 39-45 | 5 |
– |
|
35-38 |
11 | 1 |
| 31-34 | 9 |
2 |
|
28-30 |
8 | 3 |
| 24-27 | 5 |
5 |
|
Average Score |
33.2 |
28.9 |


| Students who chose to do Diploma | IB Results: Diploma Awarded | % |
| 42 | 42 | 100% |
| Students who chose to do DP Course | IB Results: DP Course results received | % |
| 6 | 6 | 100% |
| DP Score Range | Class of 2017 | Class of 2018 | Class of 2019 |
| 39-45 | 5 | 1 | 4 |
| 35-38 | 7 | 12 | 10 |
| 31-34 | 14 | 10 | 16 |
| 28-30 | 3 | 6 | 4 |
| 24-27 | 4 | 9 | 8 |
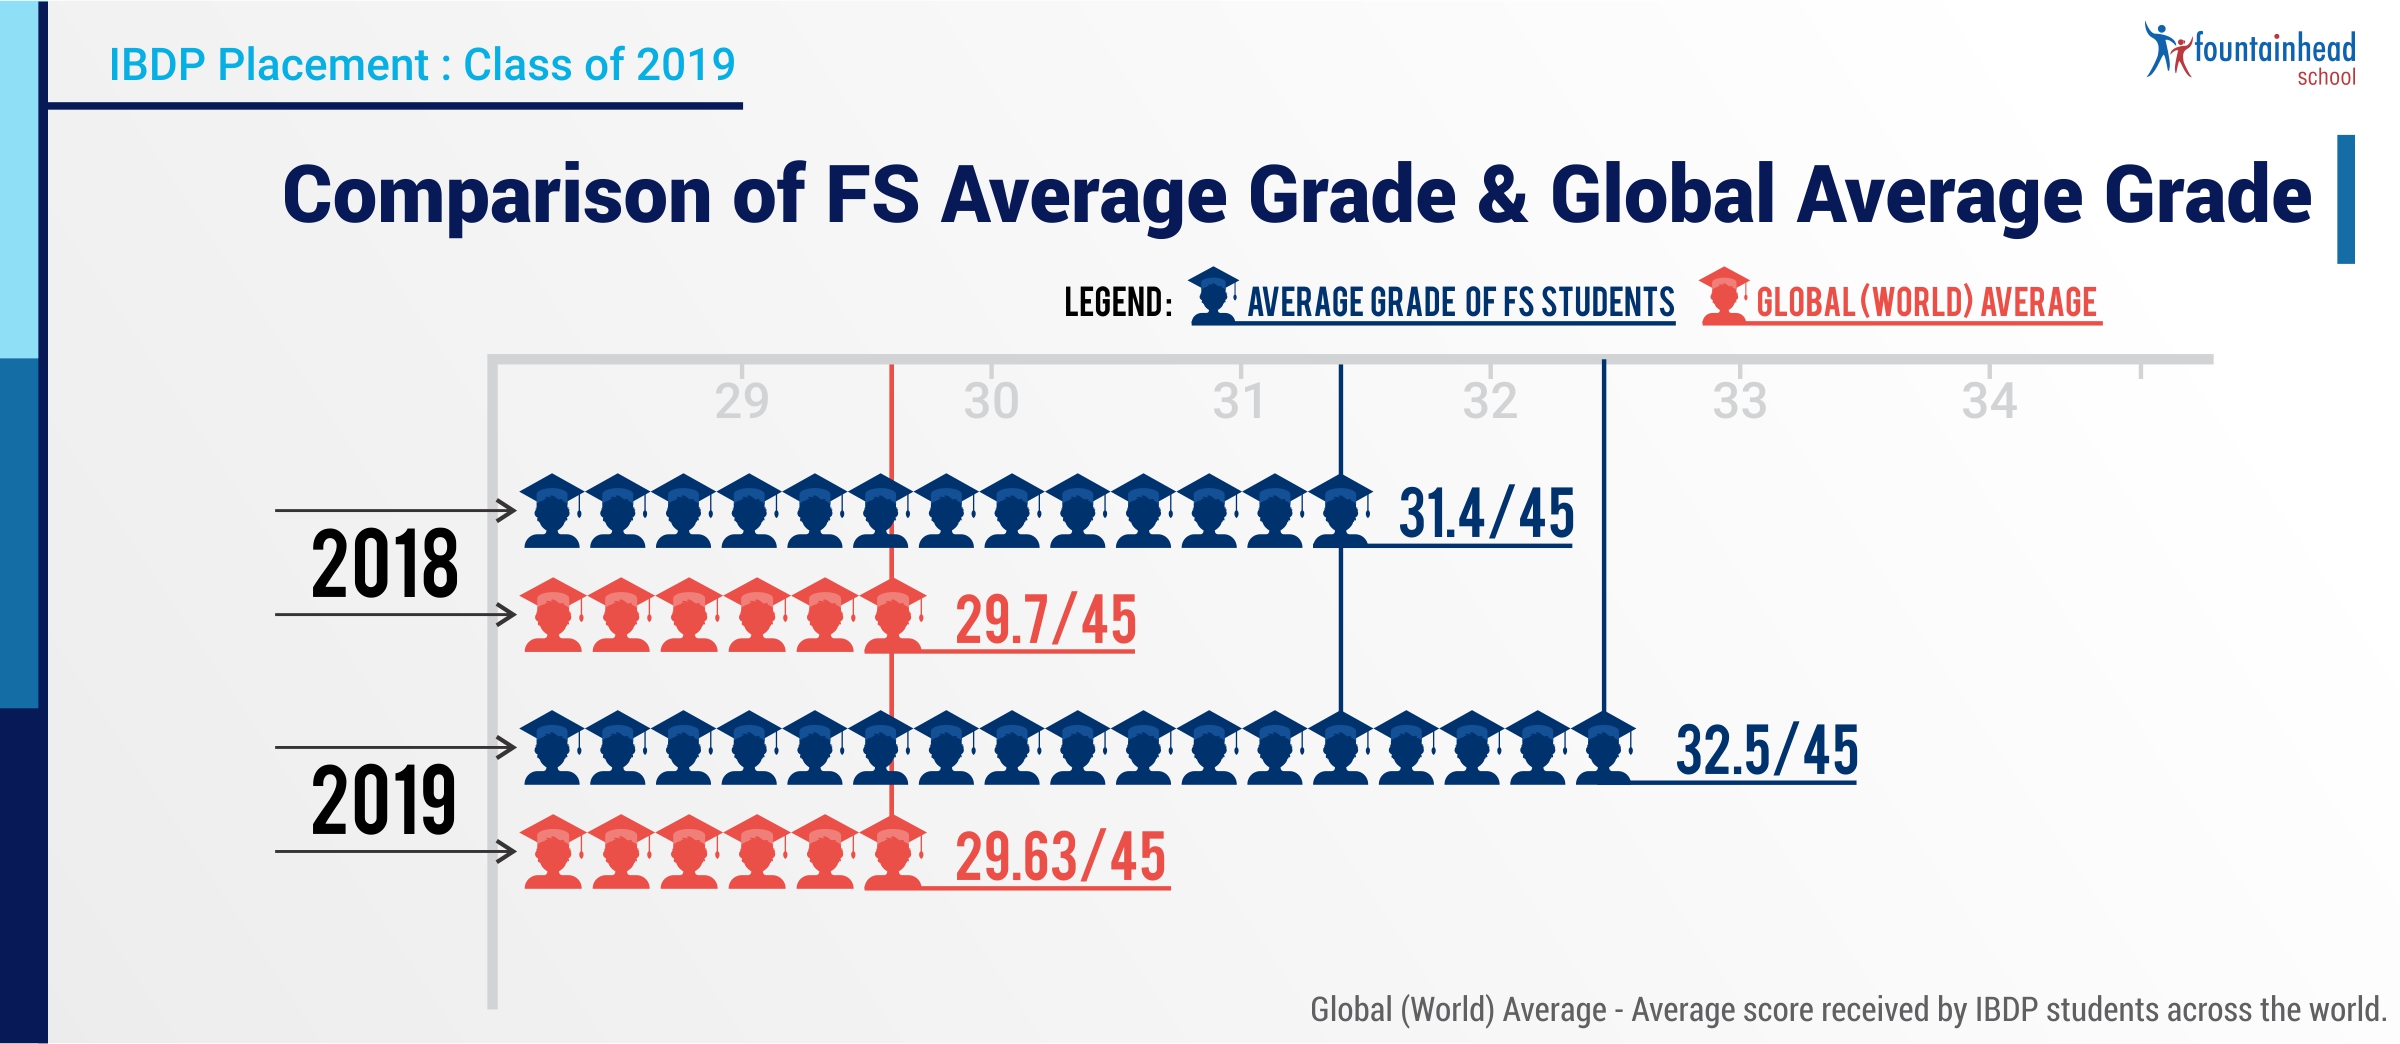
| Average Score | 33.6 | 31.4 | 32.5 |
- The number of students in the higher grade ranges has increased as compared to last year. Of course, that will vary from batch to batch based on their academic inclination and aptitude.
- The student results have shown improvement in both the Extended Essay and TOK.
- There is a difference in the way we have marked our students for the internal assessments which carry about 20-40% of the total grade and how the IB has moderated the samples it takes for cross checking. We need to understand the reasons for this difference.
- Due to the difference in the grading of IAs, variation in student performance from mock exams to the final exams, some variation in the cut-offs and the paper difficulty levels, there has been more variation in the school’s predicted grades to the final grades.


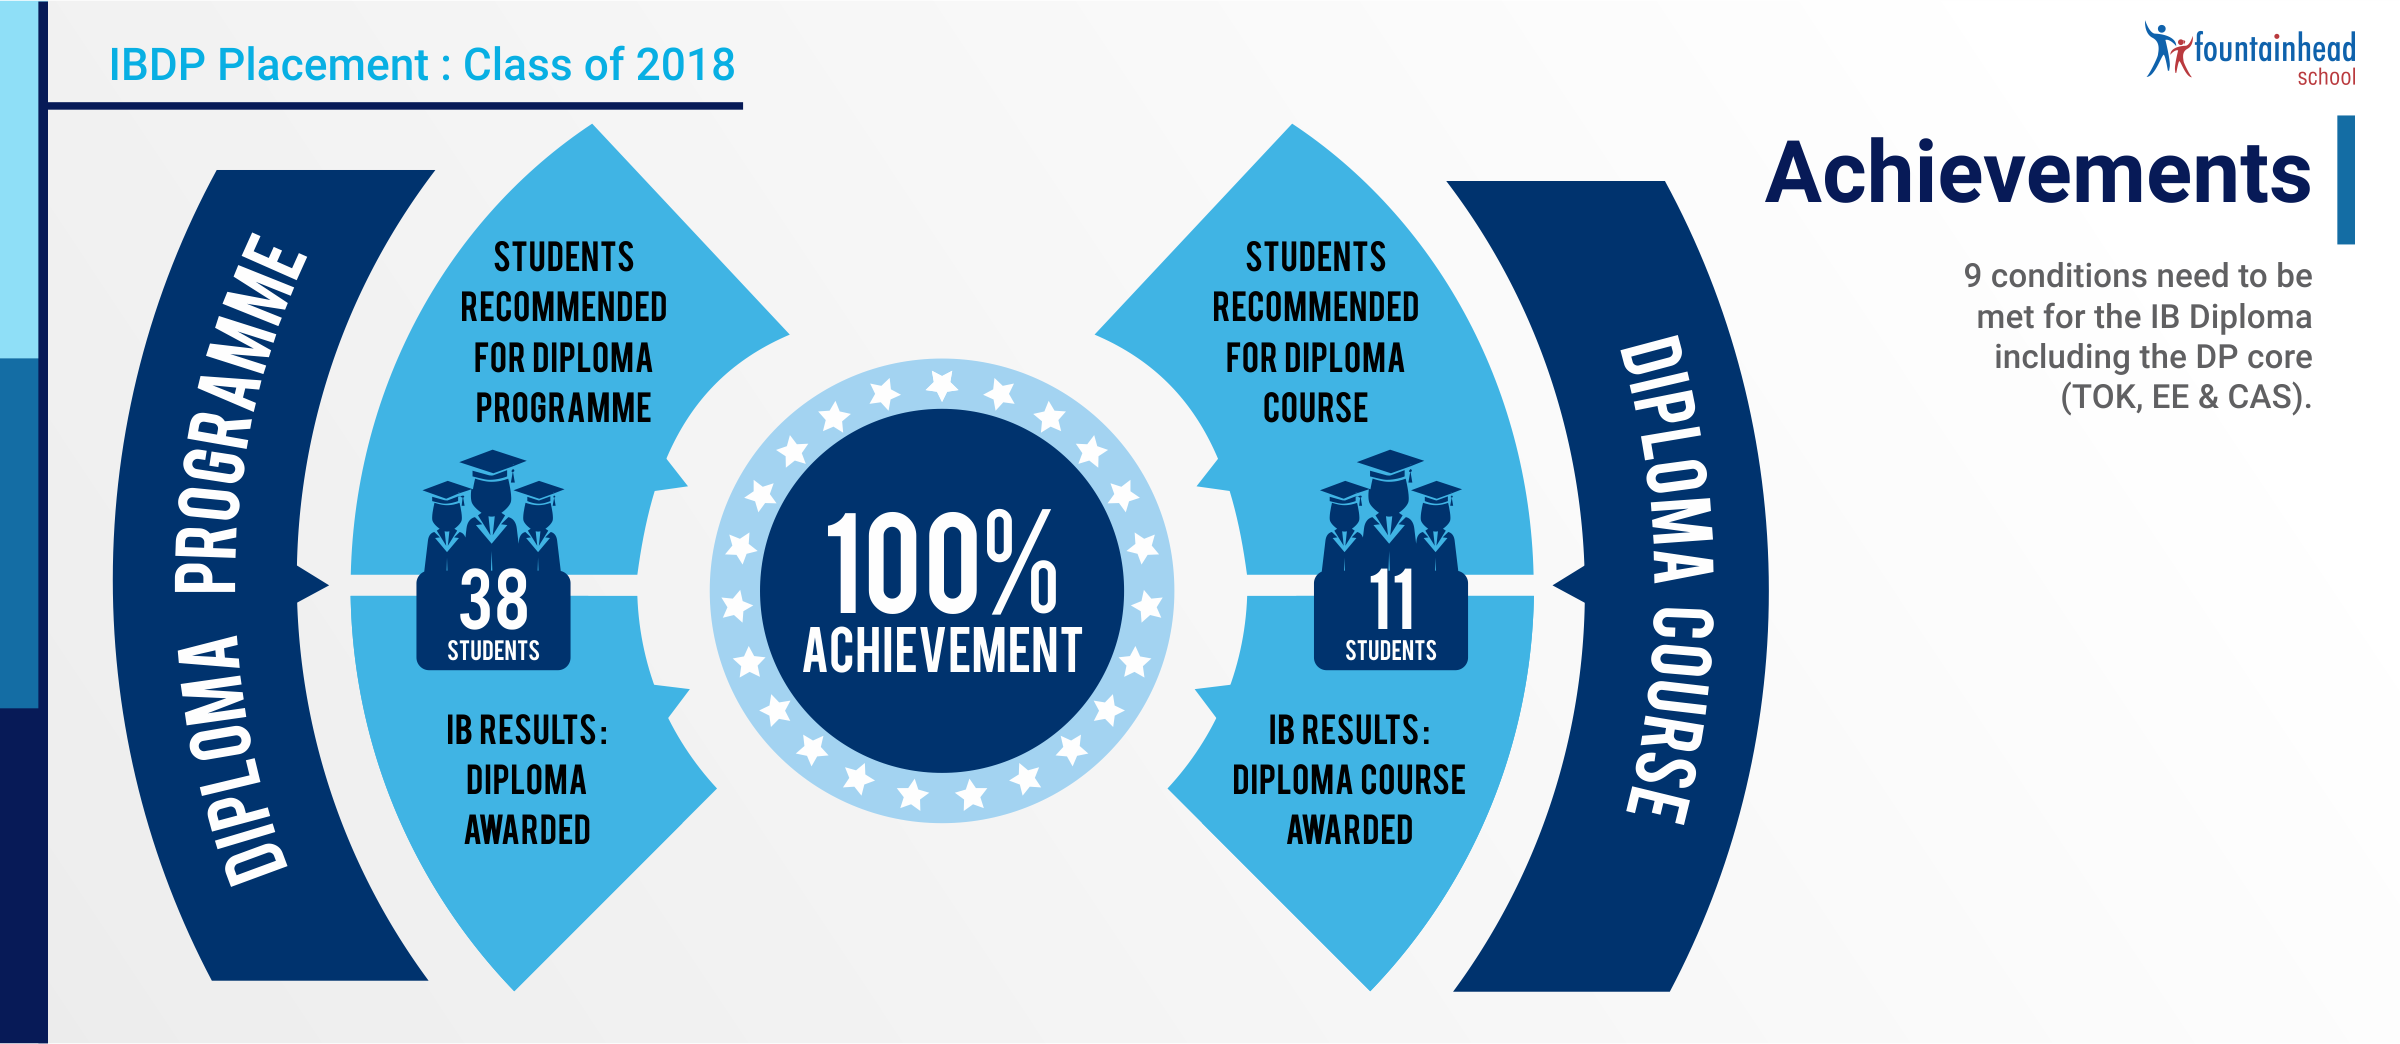
| Students recommended for Diploma | IB Results: Diploma Awarded | % |
| 38 | 38 | 100% |
| Students recommended for DP Course | IB Results: DP Course results received | % |
| 11 | 11 | 100% |
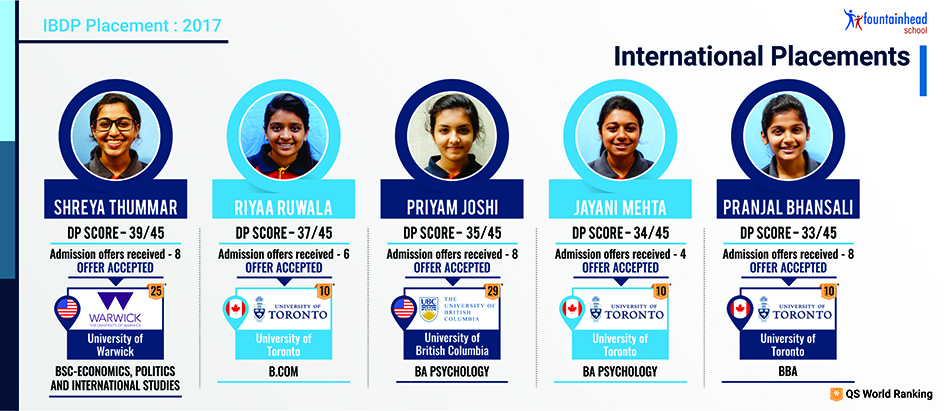
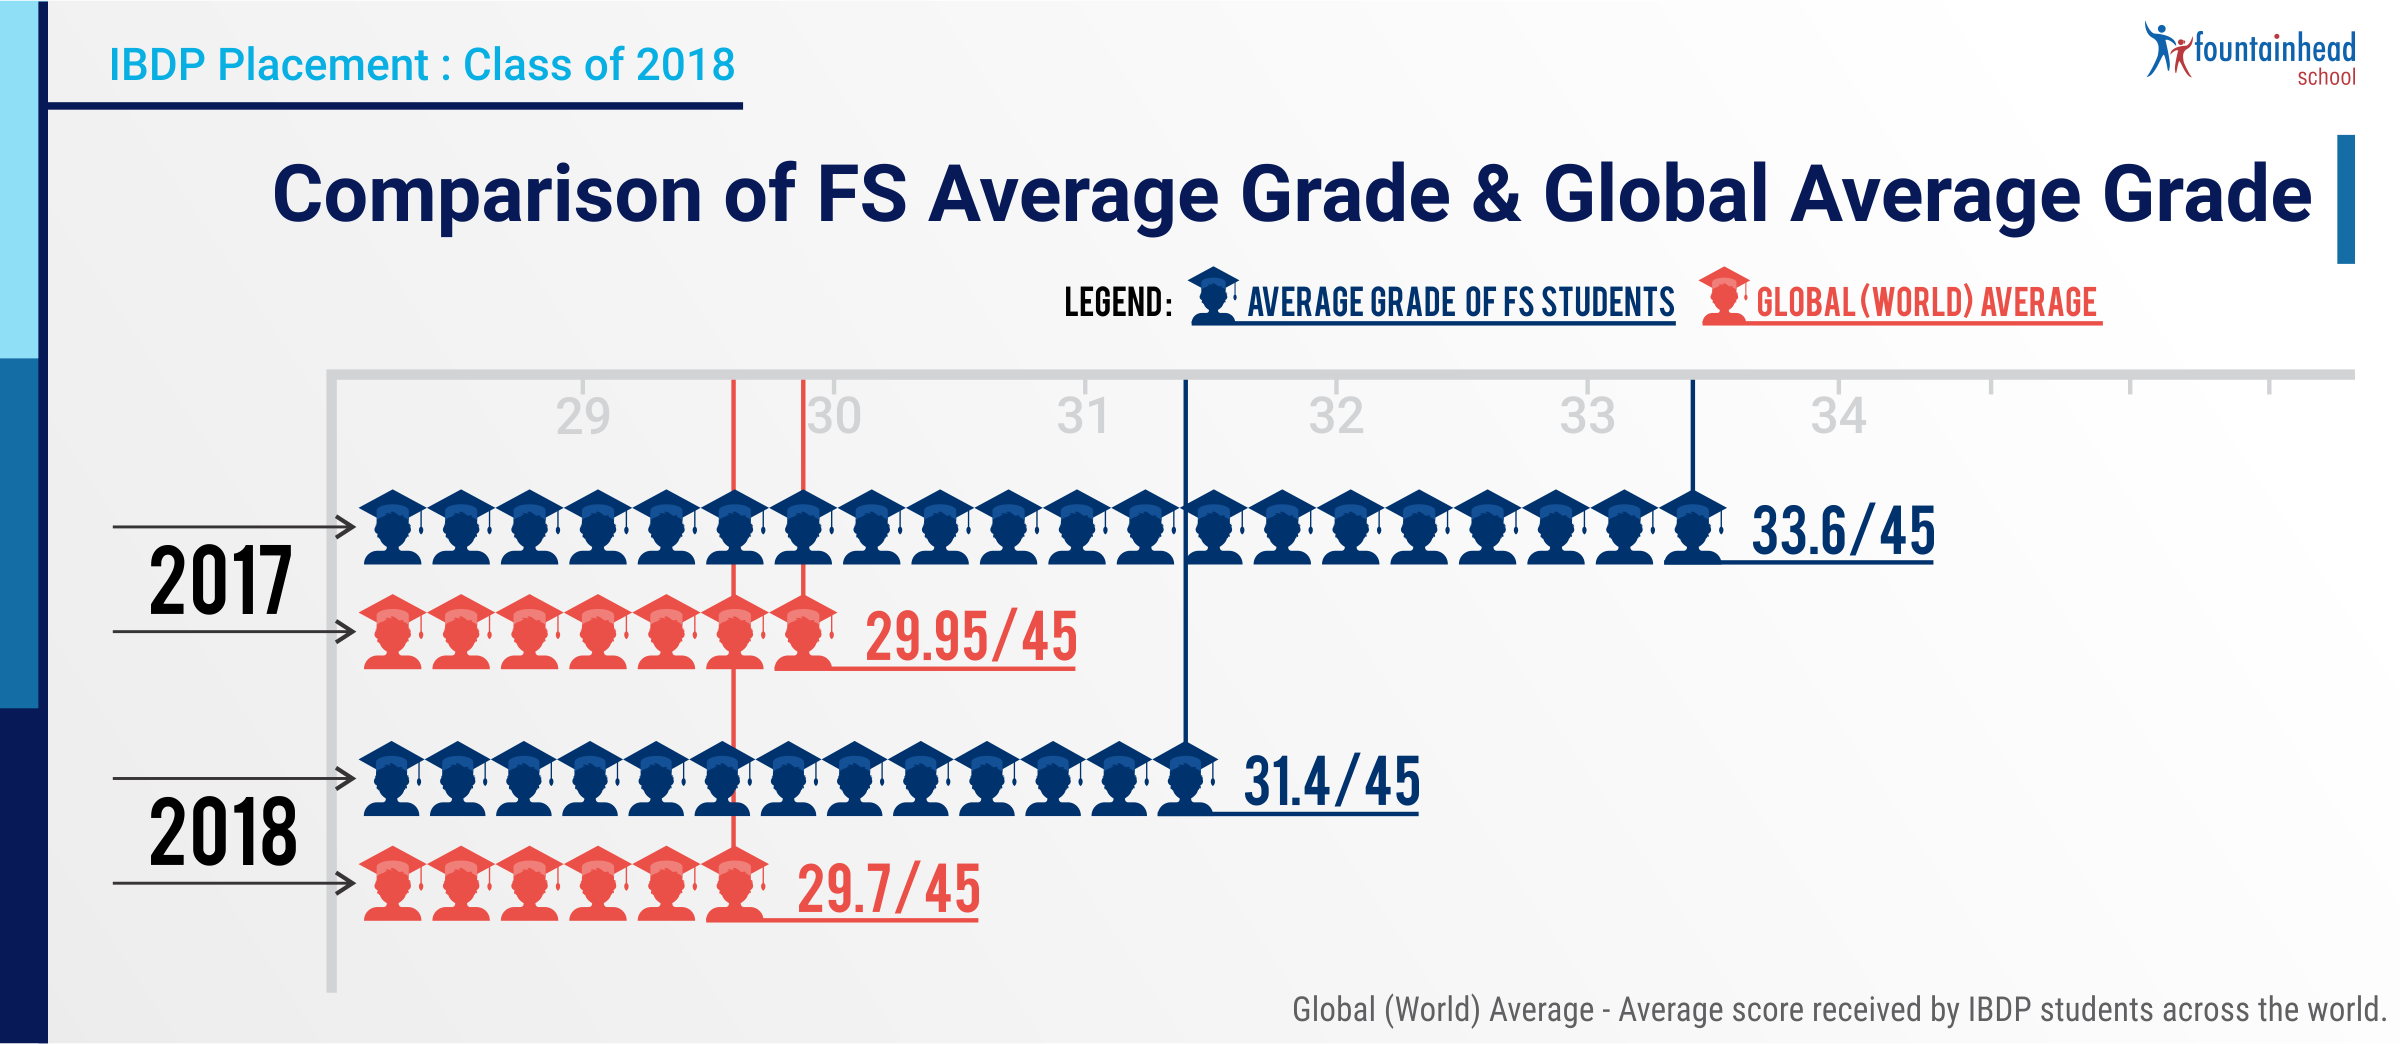
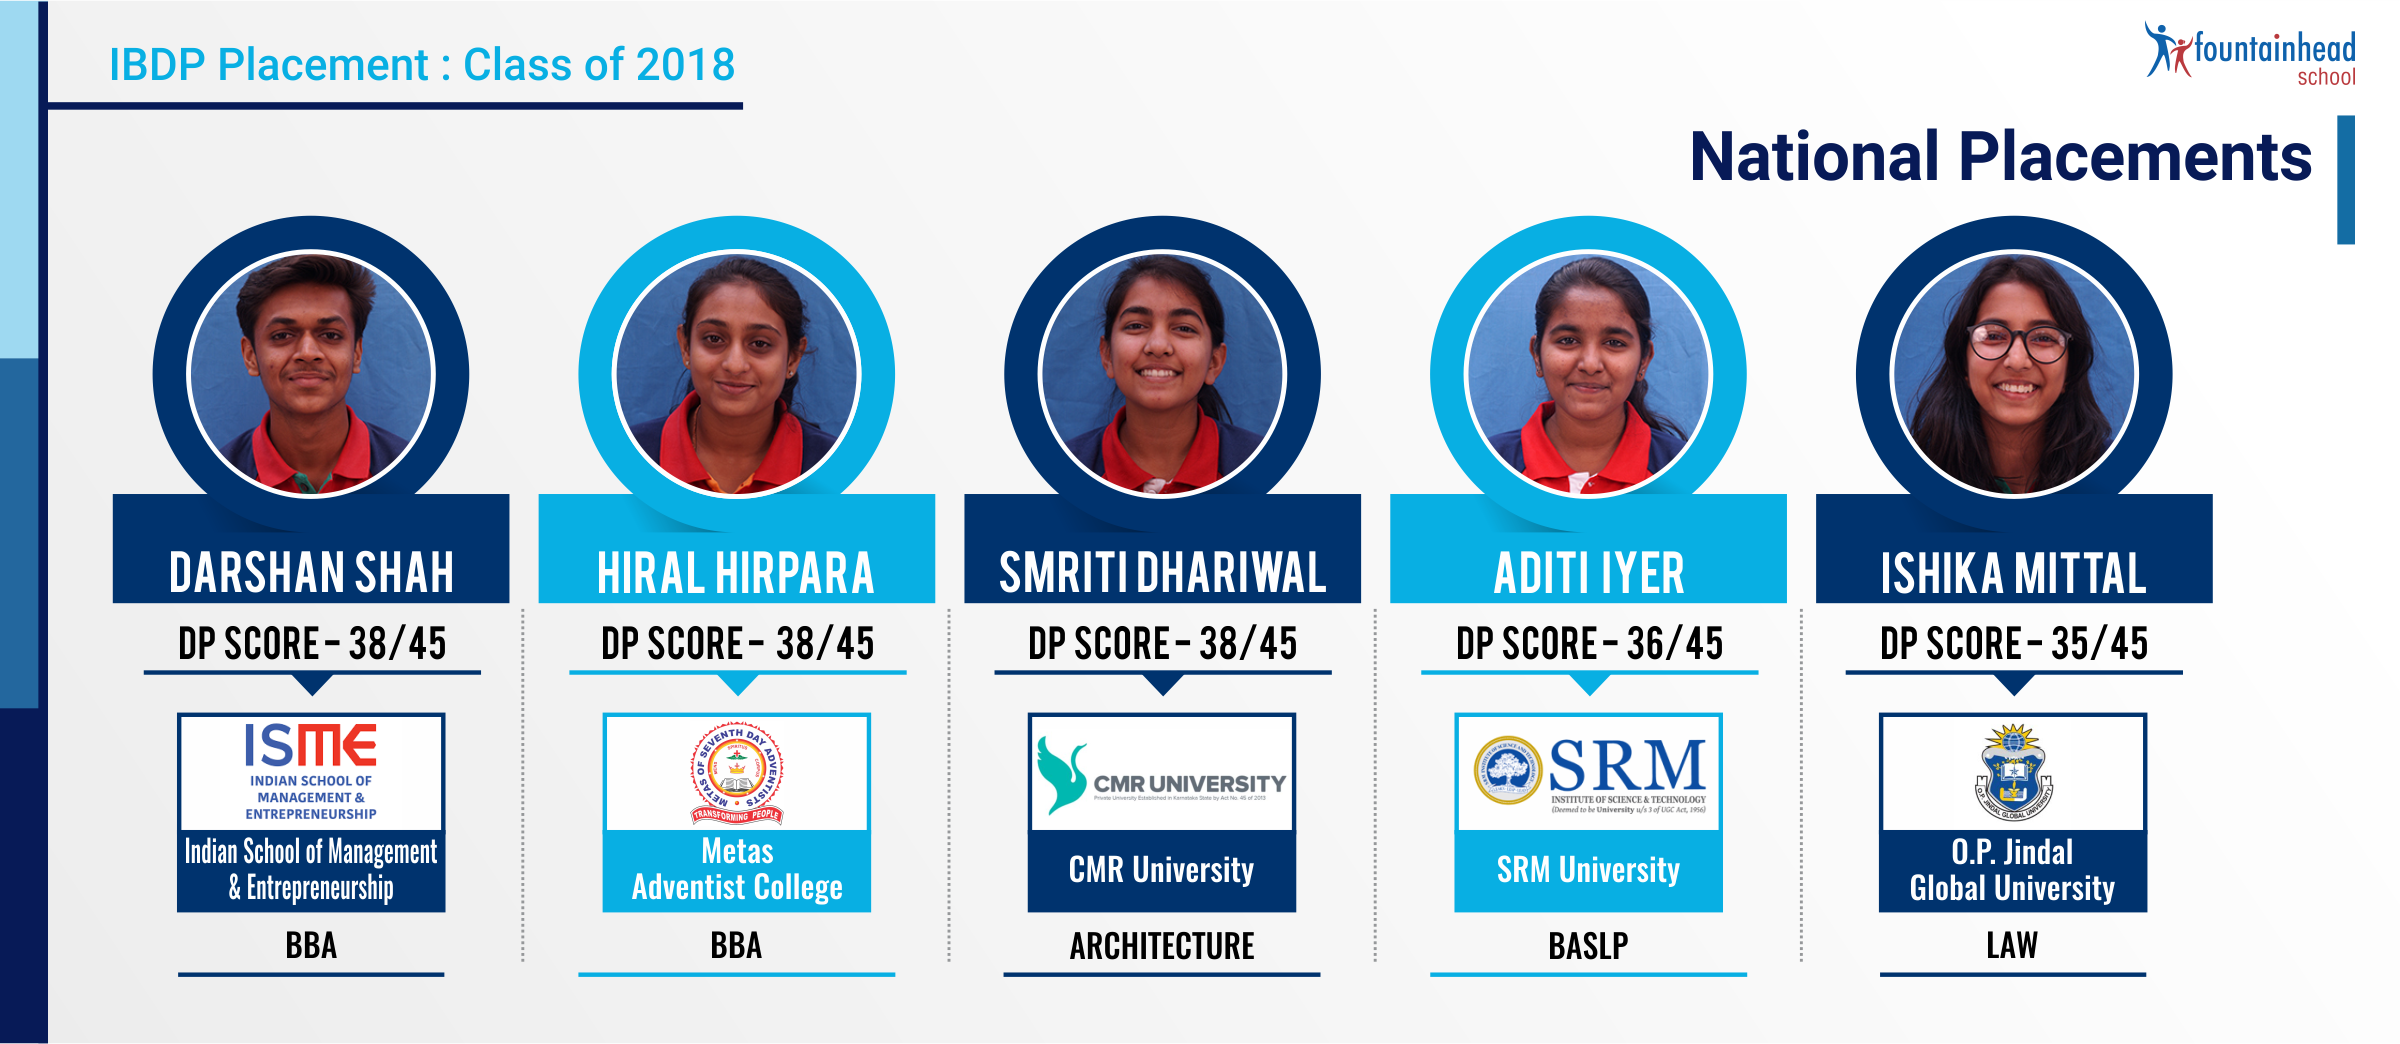
| DP Score Range | Class of 2016 | Class of 2017 | Class of 2018 |
| 38 – 45 | 1 | 7 | 3 |
| 35 – 37 | 3 | 5 | 8 |
| 31 – 34 | 8 | 14 | 12 |
| 28 – 30 | 4 | 3 | 6 |
| 24 – 27 | 11 | 2 | 9 |
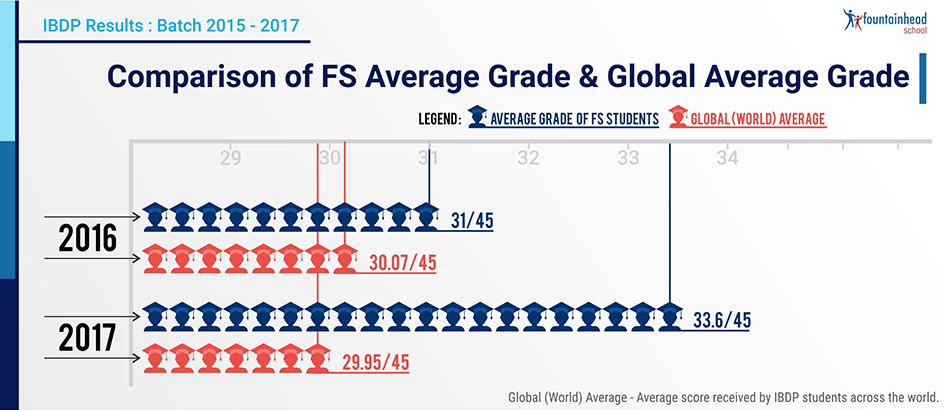
| Average Score | 31.0 | 33.6 | 31.4 |
- Our predicted grades have been quite close to actual grades, the difference between actual and predicted grades being 3.61% (on the lower side).
- While no. of students in the highest range have reduced, the number of students in the 35-38 range have increased.
- Each cohort will be different academically and the final grades will vary depending on their preparedness, accountability, work habits and the rigor and commitment that they demonstrate.
- We have offered two new subjects Global Politics and Computer Science to our students this year, and they have done quite well in both the subjects.
- There is a 16% overall difference in the prediction for Extended Essay, partly because the criteria have changed this year. We need to understand the requirements better to improve student results.

- As evident from Table 1, the number of students getting scores in the higher ranges is significantly more as compared to last year. And obviously, our highest scores have jumped.
- The average score of students has increased from 31 to 33.6
- The actual grades of students have been significantly closer to the predicted grades as compared to the prediction last year. The error in the prediction of the grades last year was 13% which has now reduced to 0.4%.
- Besides the improvement in subject grades, students have also shown better results in the TOK and Extended Essay which are the core components of the Diploma Program.
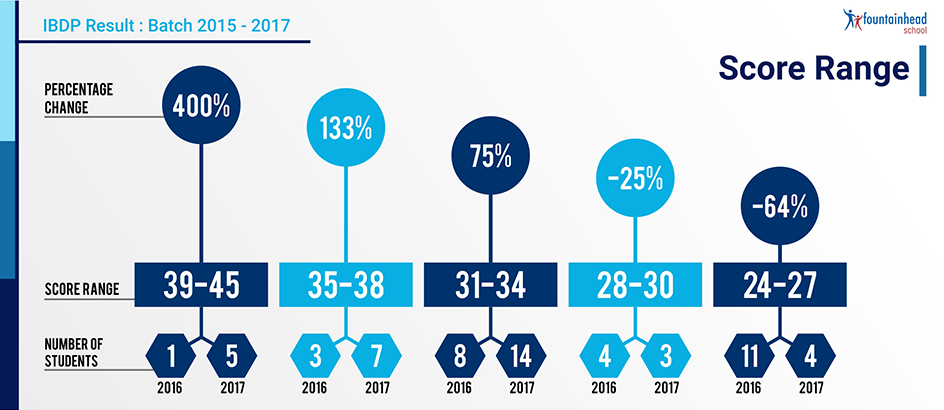
| DP Score Range | Class of 2016 | Class of 2017 | % Increment |
| 39-45 | 1 | 5 | 400% |
| 35-38 | 3 | 7 | 133% |
| 31-34 | 8 | 14 | 75% |
| 28-30 | 4 | 3 | -25% |
| 24-27 | 11 | 4 | -64% |
| Average Score | 31.0 | 33.6 |
| Class of 2016 | Class of 2017 | |
| No. of students | 1 | 5 |
| Actual Scores | 39 | 43, 41, 40, 39, 39 |